|
Download Data (XLS File) |
|
||||||||
|
||||||||
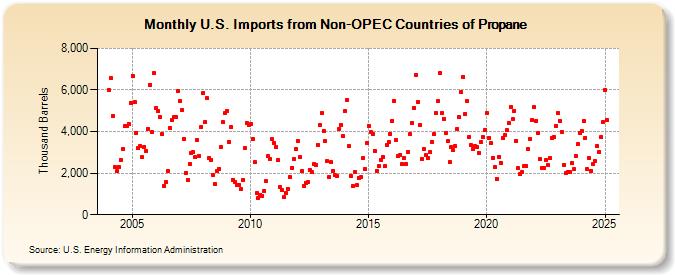
| U.S. Imports from Non-OPEC Countries of Propane (Thousand Barrels) | ||||||||
| Year | Jan | Feb | Mar | Apr | May | Jun | Jul | Aug | Sep | Oct | Nov | Dec |
|---|---|---|---|---|---|---|---|---|---|---|---|---|
| 2004 | 6,018 | 6,575 | 4,747 | 2,316 | 2,086 | 2,303 | 2,652 | 3,165 | 4,249 | 4,253 | 4,387 | 5,389 |
| 2005 | 6,695 | 5,408 | 3,936 | 3,192 | 3,313 | 2,753 | 3,263 | 3,060 | 4,143 | 6,258 | 3,959 | 6,795 |
| 2006 | 5,140 | 4,991 | 4,718 | 3,885 | 1,398 | 1,565 | 2,108 | 4,194 | 4,542 | 4,676 | 4,694 | 5,958 |
| 2007 | 5,446 | 5,026 | 3,634 | 2,007 | 1,688 | 2,461 | 2,987 | 2,993 | 2,763 | 3,617 | 2,833 | 4,222 |
| 2008 | 5,847 | 4,469 | 5,598 | 2,716 | 2,631 | 1,922 | 1,484 | 2,098 | 2,219 | 3,276 | 4,444 | 4,874 |
| 2009 | 4,989 | 3,504 | 4,230 | 1,682 | 1,578 | 1,411 | 1,421 | 1,222 | 1,692 | 3,195 | 4,408 | 4,328 |
| 2010 | 4,353 | 3,642 | 2,513 | 1,027 | 821 | 970 | 913 | 1,149 | 1,599 | 2,808 | 2,670 | 3,628 |
| 2011 | 3,448 | 3,246 | 2,635 | 1,324 | 1,174 | 833 | 1,021 | 1,253 | 1,811 | 2,261 | 2,671 | 3,163 |
| 2012 | 3,557 | 2,773 | 2,088 | 1,404 | 1,527 | 1,556 | 2,155 | 2,046 | 2,418 | 2,413 | 3,371 | 4,327 |
| 2013 | 4,896 | 4,043 | 3,534 | 2,595 | 1,822 | 2,522 | 2,119 | 1,893 | 1,877 | 4,143 | 4,320 | 3,763 |
| 2014 | 4,983 | 5,540 | 3,289 | 1,883 | 1,392 | 2,059 | 1,421 | 1,779 | 1,796 | 2,709 | 2,187 | 3,426 |
| 2015 | 4,282 | 3,980 | 3,872 | 3,088 | 2,118 | 2,323 | 2,618 | 2,754 | 2,322 | 3,365 | 3,476 | 3,893 |
| 2016 | 4,518 | 5,480 | 3,570 | 2,826 | 2,894 | 2,419 | 2,732 | 2,459 | 3,031 | 3,863 | 4,427 | 5,149 |
| 2017 | 6,734 | 5,429 | 4,325 | 2,680 | 3,158 | 2,853 | 2,706 | 3,006 | 3,514 | 3,863 | 4,886 | 5,452 |
| 2018 | 6,814 | 4,889 | 4,622 | 3,931 | 3,530 | 2,542 | 3,233 | 3,090 | 3,299 | 4,116 | 4,683 | 5,901 |
| 2019 | 6,635 | 4,835 | 5,449 | 3,733 | 3,332 | 3,147 | 3,289 | 3,249 | 2,991 | 3,494 | 3,733 | 4,058 |
| 2020 | 4,889 | 3,690 | 3,433 | 2,740 | 2,272 | 1,737 | 2,799 | 2,507 | 3,686 | 3,832 | 4,060 | 4,412 |
| 2021 | 5,177 | 4,597 | 5,012 | 3,559 | 2,231 | 1,937 | 2,051 | 2,353 | 2,334 | 3,144 | 3,655 | 4,547 |
| 2022 | 5,176 | 4,531 | 3,940 | 2,667 | 2,260 | 2,229 | 2,614 | 2,374 | 2,716 | 3,692 | 3,739 | 4,279 |
| 2023 | 4,829 | 4,569 | 3,969 | 2,335 | 1,991 | 2,063 | 2,061 | 2,487 | 2,181 | 2,865 | 3,381 | 3,944 |
| 2024 | 4,038 | |||||||||||
| - = No Data Reported; -- = Not Applicable; NA = Not Available; W = Withheld to avoid disclosure of individual company data. |
| Release Date: 3/29/2024 |
| Next Release Date: 4/30/2024 |
Referring Pages: