|
Download Data (XLS File) |
|
||||||||
|
||||||||
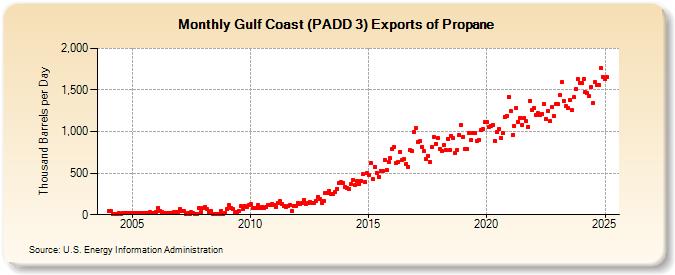
| Gulf Coast (PADD 3) Exports of Propane (Thousand Barrels per Day) | ||||||||
| Year | Jan | Feb | Mar | Apr | May | Jun | Jul | Aug | Sep | Oct | Nov | Dec |
|---|---|---|---|---|---|---|---|---|---|---|---|---|
| 2004 | 39 | 41 | 11 | 11 | 10 | 15 | 12 | 18 | 17 | 15 | 16 | 19 |
| 2005 | 15 | 17 | 15 | 21 | 22 | 21 | 21 | 25 | 16 | 28 | 15 | 25 |
| 2006 | 33 | 84 | 46 | 38 | 19 | 16 | 18 | 20 | 15 | 28 | 35 | 36 |
| 2007 | 67 | 44 | 40 | 12 | 20 | 14 | 27 | 15 | 12 | 11 | 78 | 33 |
| 2008 | 86 | 95 | 66 | 34 | 45 | 13 | 11 | 12 | 13 | 48 | 11 | 23 |
| 2009 | 69 | 112 | 78 | 65 | 33 | 38 | 47 | 101 | 69 | 110 | 93 | 113 |
| 2010 | 123 | 84 | 85 | 81 | 112 | 81 | 96 | 86 | 96 | 113 | 112 | 128 |
| 2011 | 118 | 93 | 144 | 160 | 133 | 108 | 89 | 101 | 118 | 44 | 106 | 105 |
| 2012 | 146 | 128 | 138 | 174 | 133 | 146 | 154 | 145 | 135 | 167 | 216 | 185 |
| 2013 | 145 | 170 | 266 | 264 | 290 | 251 | 255 | 277 | 313 | 387 | 389 | 380 |
| 2014 | 334 | 325 | 313 | 370 | 416 | 352 | 403 | 366 | 411 | 484 | 399 | 500 |
| 2015 | 478 | 617 | 428 | 578 | 504 | 459 | 528 | 531 | 661 | 535 | 630 | 678 |
| 2016 | 793 | 812 | 616 | 636 | 760 | 660 | 672 | 610 | 577 | 779 | 765 | 996 |
| 2017 | 1,038 | 874 | 883 | 817 | 763 | 671 | 707 | 637 | 817 | 938 | 854 | 917 |
| 2018 | 795 | 763 | 837 | 776 | 914 | 780 | 947 | 918 | 738 | 782 | 958 | 1,081 |
| 2019 | 938 | 790 | 788 | 988 | 902 | 977 | 984 | 886 | 904 | 1,013 | 1,031 | 1,110 |
| 2020 | 1,112 | 1,055 | 1,070 | 1,075 | 885 | 994 | 1,025 | 927 | 980 | 1,179 | 1,190 | 1,418 |
| 2021 | 1,246 | 961 | 1,067 | 1,282 | 1,120 | 1,167 | 1,084 | 1,160 | 1,123 | 1,059 | 1,370 | 1,254 |
| 2022 | 1,279 | 1,205 | 1,219 | 1,198 | 1,215 | 1,330 | 1,155 | 1,250 | 1,123 | 1,291 | 1,187 | 1,336 |
| 2023 | 1,324 | 1,409 | 1,510 | 1,284 | 1,263 | 1,275 | 1,363 | 1,241 | 1,374 | 1,502 | 1,651 | 1,605 |
| 2024 | 1,582 | |||||||||||
| - = No Data Reported; -- = Not Applicable; NA = Not Available; W = Withheld to avoid disclosure of individual company data. |
| Release Date: 3/29/2024 |
| Next Release Date: 4/30/2024 |