|
Download Data (XLS File) |
|
||||||||
|
||||||||
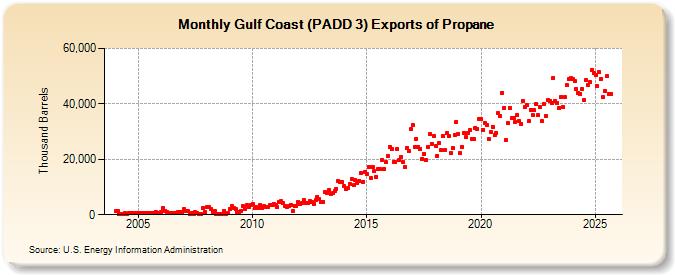
| Gulf Coast (PADD 3) Exports of Propane (Thousand Barrels) | ||||||||
| Year | Jan | Feb | Mar | Apr | May | Jun | Jul | Aug | Sep | Oct | Nov | Dec |
|---|---|---|---|---|---|---|---|---|---|---|---|---|
| 2004 | 1,197 | 1,192 | 345 | 315 | 301 | 458 | 361 | 547 | 507 | 477 | 490 | 603 |
| 2005 | 463 | 484 | 464 | 633 | 674 | 616 | 660 | 769 | 479 | 869 | 439 | 782 |
| 2006 | 1,018 | 2,341 | 1,433 | 1,153 | 586 | 488 | 543 | 619 | 461 | 878 | 1,037 | 1,128 |
| 2007 | 2,090 | 1,224 | 1,234 | 373 | 619 | 410 | 841 | 463 | 375 | 334 | 2,344 | 1,009 |
| 2008 | 2,666 | 2,756 | 2,050 | 1,034 | 1,394 | 388 | 336 | 377 | 392 | 1,495 | 339 | 699 |
| 2009 | 2,132 | 3,132 | 2,409 | 1,957 | 1,035 | 1,129 | 1,452 | 3,127 | 2,085 | 3,405 | 2,776 | 3,515 |
| 2010 | 3,826 | 2,348 | 2,628 | 2,442 | 3,460 | 2,429 | 2,977 | 2,661 | 2,888 | 3,491 | 3,359 | 3,978 |
| 2011 | 3,645 | 2,609 | 4,465 | 4,803 | 4,131 | 3,236 | 2,752 | 3,138 | 3,530 | 1,364 | 3,167 | 3,245 |
| 2012 | 4,530 | 3,707 | 4,285 | 5,216 | 4,119 | 4,374 | 4,786 | 4,491 | 4,037 | 5,190 | 6,485 | 5,735 |
| 2013 | 4,485 | 4,751 | 8,243 | 7,919 | 9,004 | 7,519 | 7,909 | 8,583 | 9,395 | 12,003 | 11,673 | 11,779 |
| 2014 | 10,362 | 9,097 | 9,702 | 11,098 | 12,911 | 10,554 | 12,488 | 11,332 | 12,331 | 15,018 | 11,968 | 15,490 |
| 2015 | 14,808 | 17,265 | 13,263 | 17,345 | 15,623 | 13,781 | 16,373 | 16,463 | 19,830 | 16,570 | 18,908 | 21,024 |
| 2016 | 24,596 | 23,539 | 19,089 | 19,081 | 23,559 | 19,790 | 20,822 | 18,898 | 17,316 | 24,150 | 22,960 | 30,867 |
| 2017 | 32,186 | 24,480 | 27,367 | 24,521 | 23,657 | 20,124 | 21,929 | 19,757 | 24,501 | 29,081 | 25,622 | 28,417 |
| 2018 | 24,654 | 21,352 | 25,953 | 23,292 | 28,329 | 23,403 | 29,368 | 28,452 | 22,152 | 24,232 | 28,741 | 33,511 |
| 2019 | 29,087 | 22,132 | 24,441 | 29,636 | 27,958 | 29,316 | 30,497 | 27,474 | 27,133 | 31,417 | 30,924 | 34,424 |
| 2020 | 34,460 | 30,606 | 33,182 | 32,263 | 27,428 | 29,817 | 31,777 | 28,724 | 29,404 | 36,535 | 35,687 | 43,957 |
| 2021 | 38,632 | 26,907 | 33,065 | 38,472 | 34,727 | 35,000 | 33,616 | 35,972 | 33,702 | 32,822 | 41,099 | 38,884 |
| 2022 | 39,664 | 33,747 | 37,788 | 35,944 | 37,661 | 39,908 | 35,795 | 38,735 | 33,689 | 40,012 | 35,612 | 41,415 |
| 2023 | 41,036 | 39,460 | 46,795 | 38,523 | 39,144 | 38,238 | 42,242 | 38,466 | 41,213 | 46,563 | 49,527 | 49,763 |
| 2024 | 49,055 | 47,235 | 45,564 | 43,896 | ||||||||
| - = No Data Reported; -- = Not Applicable; NA = Not Available; W = Withheld to avoid disclosure of individual company data. |
| Release Date: 6/28/2024 |
| Next Release Date: 7/31/2024 |