|
Download Data (XLS File) |
|
||||||||
|
||||||||
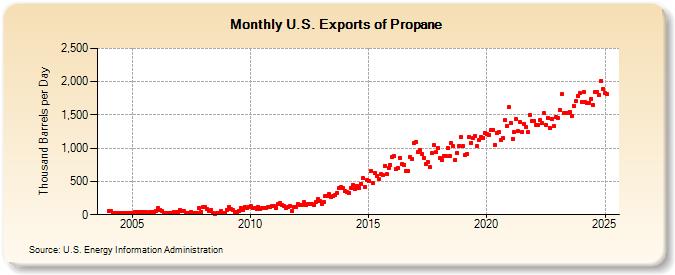
| U.S. Exports of Propane (Thousand Barrels per Day) | ||||||||
| Year | Jan | Feb | Mar | Apr | May | Jun | Jul | Aug | Sep | Oct | Nov | Dec |
|---|---|---|---|---|---|---|---|---|---|---|---|---|
| 2004 | 49 | 51 | 21 | 22 | 19 | 25 | 22 | 26 | 26 | 25 | 26 | 29 |
| 2005 | 28 | 35 | 34 | 38 | 39 | 42 | 39 | 40 | 32 | 44 | 34 | 44 |
| 2006 | 50 | 103 | 66 | 58 | 33 | 26 | 26 | 30 | 24 | 43 | 43 | 46 |
| 2007 | 78 | 54 | 51 | 26 | 30 | 25 | 38 | 25 | 21 | 20 | 97 | 45 |
| 2008 | 120 | 117 | 87 | 50 | 72 | 22 | 18 | 19 | 20 | 56 | 20 | 31 |
| 2009 | 76 | 120 | 85 | 73 | 42 | 46 | 55 | 107 | 77 | 116 | 100 | 121 |
| 2010 | 131 | 95 | 94 | 93 | 121 | 91 | 105 | 95 | 104 | 120 | 120 | 138 |
| 2011 | 127 | 105 | 155 | 175 | 148 | 124 | 102 | 114 | 134 | 59 | 122 | 123 |
| 2012 | 164 | 144 | 151 | 187 | 145 | 160 | 167 | 155 | 148 | 189 | 233 | 204 |
| 2013 | 163 | 189 | 285 | 283 | 308 | 267 | 275 | 294 | 333 | 408 | 410 | 400 |
| 2014 | 355 | 342 | 331 | 407 | 451 | 384 | 436 | 404 | 462 | 549 | 424 | 522 |
| 2015 | 511 | 662 | 470 | 629 | 583 | 538 | 607 | 597 | 739 | 605 | 697 | 751 |
| 2016 | 865 | 876 | 682 | 701 | 854 | 761 | 752 | 664 | 656 | 870 | 832 | 1,073 |
| 2017 | 1,100 | 947 | 973 | 916 | 859 | 756 | 795 | 716 | 923 | 1,044 | 936 | 1,002 |
| 2018 | 849 | 818 | 889 | 876 | 1,003 | 877 | 1,075 | 1,033 | 823 | 928 | 1,038 | 1,163 |
| 2019 | 1,030 | 892 | 918 | 1,166 | 1,085 | 1,158 | 1,188 | 1,035 | 1,124 | 1,168 | 1,159 | 1,235 |
| 2020 | 1,210 | 1,205 | 1,267 | 1,279 | 1,054 | 1,229 | 1,243 | 1,129 | 1,150 | 1,423 | 1,331 | 1,615 |
| 2021 | 1,384 | 1,143 | 1,239 | 1,435 | 1,256 | 1,391 | 1,244 | 1,365 | 1,315 | 1,237 | 1,502 | 1,402 |
| 2022 | 1,409 | 1,352 | 1,352 | 1,421 | 1,372 | 1,527 | 1,351 | 1,461 | 1,299 | 1,439 | 1,330 | 1,470 |
| 2023 | 1,456 | 1,553 | 1,695 | 1,465 | 1,479 | 1,501 | 1,545 | 1,470 | 1,607 | 1,696 | 1,806 | 1,865 |
| 2024 | 1,699 | |||||||||||
| - = No Data Reported; -- = Not Applicable; NA = Not Available; W = Withheld to avoid disclosure of individual company data. |
| Release Date: 3/29/2024 |
| Next Release Date: 4/30/2024 |
Referring Pages: