|
Download Data (XLS File) |
|
||||||||
|
||||||||
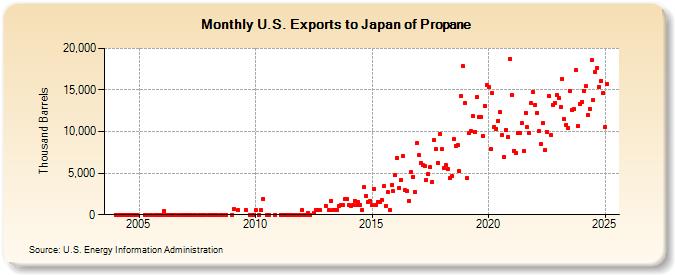
| U.S. Exports to Japan of Propane (Thousand Barrels) | ||||||||
| Year | Jan | Feb | Mar | Apr | May | Jun | Jul | Aug | Sep | Oct | Nov | Dec |
|---|---|---|---|---|---|---|---|---|---|---|---|---|
| 2004 | 1 | 1 | 1 | 0 | 1 | 0 | 1 | 0 | 1 | 1 | 2 | |
| 2005 | 1 | 1 | 1 | 1 | 1 | 1 | 1 | |||||
| 2006 | 1 | 496 | 1 | 1 | 1 | 1 | 1 | 1 | 1 | 1 | 2 | |
| 2007 | 1 | 1 | 1 | 1 | 1 | 1 | 1 | 0 | 1 | |||
| 2008 | 0 | 0 | 1 | 2 | 2 | 1 | 2 | 0 | ||||
| 2009 | 1 | 716 | 550 | 545 | 0 | 0 | 1 | |||||
| 2010 | 512 | 1 | 550 | 1,911 | 0 | 1 | 1 | |||||
| 2011 | 1 | 0 | 0 | 0 | 0 | 0 | 0 | 1 | 0 | |||
| 2012 | 550 | 0 | 0 | 263 | 1 | 260 | 550 | 550 | 550 | |||
| 2013 | 1,100 | 525 | 1,695 | 525 | 575 | 575 | 1,100 | 1,150 | 1,150 | 1,878 | 1,942 | |
| 2014 | 1,124 | 1,102 | 1,154 | 1,706 | 1,150 | 1,516 | 1,150 | 526 | 3,295 | 2,274 | 1,517 | 1,669 |
| 2015 | 1,140 | 3,120 | 1,162 | 1,576 | 1,514 | 1,778 | 3,403 | 1,101 | 2,698 | 527 | 3,575 | 2,804 |
| 2016 | 4,755 | 6,822 | 3,249 | 4,126 | 7,006 | 2,966 | 2,837 | 1,700 | 5,078 | 4,594 | 2,789 | 8,571 |
| 2017 | 7,141 | 6,213 | 5,971 | 5,865 | 4,228 | 4,921 | 5,704 | 3,984 | 8,962 | 7,874 | 6,237 | 9,677 |
| 2018 | 7,849 | 5,673 | 5,980 | 5,504 | 4,368 | 4,601 | 9,104 | 8,294 | 8,324 | 5,212 | 14,230 | 17,842 |
| 2019 | 13,380 | 4,382 | 9,793 | 10,015 | 11,817 | 9,987 | 14,095 | 11,718 | 11,700 | 9,470 | 13,063 | 15,566 |
| 2020 | 15,377 | 7,903 | 14,645 | 10,544 | 10,312 | 11,323 | 12,307 | 9,565 | 6,988 | 10,242 | 9,381 | 18,765 |
| 2021 | 14,416 | 7,719 | 7,476 | 9,778 | 9,806 | 11,013 | 7,648 | 12,277 | 10,488 | 9,839 | 13,374 | 14,698 |
| 2022 | 13,242 | 12,258 | 10,066 | 8,506 | 10,986 | 7,790 | 10,002 | 14,328 | 9,566 | 13,213 | 13,490 | 14,391 |
| 2023 | 15,225 | 14,139 | 17,307 | 10,776 | 11,106 | 11,292 | 15,919 | 13,863 | 14,162 | 18,176 | 12,237 | 14,700 |
| 2024 | 13,589 | |||||||||||
| - = No Data Reported; -- = Not Applicable; NA = Not Available; W = Withheld to avoid disclosure of individual company data. |
| Release Date: 3/29/2024 |
| Next Release Date: 4/30/2024 |