|
Download Data (XLS File) |
|
||||||||
|
||||||||
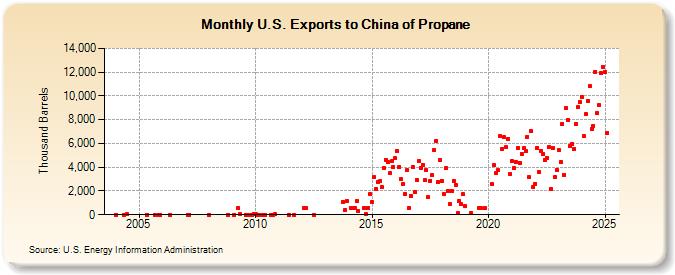
| U.S. Exports to China of Propane (Thousand Barrels) | ||||||||
| Year | Jan | Feb | Mar | Apr | May | Jun | Jul | Aug | Sep | Oct | Nov | Dec |
|---|---|---|---|---|---|---|---|---|---|---|---|---|
| 2004 | 0 | 4 | 23 | |||||||||
| 2005 | 3 | 0 | 0 | 0 | ||||||||
| 2006 | 0 | |||||||||||
| 2007 | 0 | 0 | ||||||||||
| 2008 | 14 | 0 | ||||||||||
| 2009 | 14 | 570 | 28 | 0 | 0 | 0 | 73 | |||||
| 2010 | 35 | 0 | 0 | 1 | 0 | 0 | 17 | 25 | ||||
| 2011 | 0 | 0 | ||||||||||
| 2012 | 550 | 550 | 0 | |||||||||
| 2013 | 1,105 | 389 | 1,154 | |||||||||
| 2014 | 577 | 577 | 574 | 1,159 | 311 | 577 | 52 | 577 | 1,711 | |||
| 2015 | 1,090 | 3,165 | 2,167 | 2,727 | 2,814 | 2,321 | 3,916 | 4,612 | 4,465 | 3,489 | 4,494 | 4,027 |
| 2016 | 4,743 | 5,363 | 4,037 | 2,968 | 2,611 | 1,771 | 3,736 | 576 | 1,615 | 4,009 | 1,893 | 2,935 |
| 2017 | 4,487 | 3,954 | 4,225 | 2,887 | 3,753 | 1,450 | 2,868 | 3,302 | 5,438 | 6,246 | 2,787 | 4,626 |
| 2018 | 2,875 | 1,731 | 3,940 | 1,970 | 866 | 2,006 | 2,833 | 2,530 | 144 | 1,158 | 876 | 1,704 |
| 2019 | 693 | 152 | 575 | 569 | 578 | |||||||
| 2020 | 2,544 | 4,162 | 3,547 | 3,751 | 6,603 | 5,548 | 6,518 | 5,684 | 6,376 | 3,432 | ||
| 2021 | 4,518 | 3,943 | 4,439 | 5,645 | 4,378 | 5,114 | 5,618 | 5,323 | 6,578 | 3,150 | 7,064 | 2,294 |
| 2022 | 2,625 | 5,620 | 3,623 | 5,389 | 5,151 | 4,639 | 4,803 | 5,703 | 2,132 | 5,652 | 3,151 | 3,783 |
| 2023 | 5,578 | 3,715 | 6,537 | 3,506 | 8,967 | 9,115 | 6,070 | 5,084 | 4,929 | 7,646 | 9,025 | 8,356 |
| 2024 | 9,919 | |||||||||||
| - = No Data Reported; -- = Not Applicable; NA = Not Available; W = Withheld to avoid disclosure of individual company data. |
| Release Date: 3/29/2024 |
| Next Release Date: 4/30/2024 |