|
Download Data (XLS File) |
|
||||||||
|
||||||||
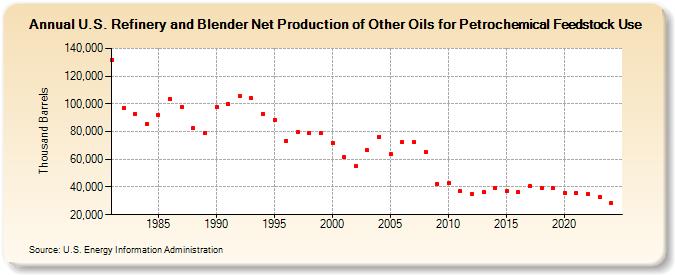
| U.S. Refinery and Blender Net Production of Other Oils for Petrochemical Feedstock Use (Thousand Barrels) | ||||||||
| Decade | Year-0 | Year-1 | Year-2 | Year-3 | Year-4 | Year-5 | Year-6 | Year-7 | Year-8 | Year-9 |
|---|---|---|---|---|---|---|---|---|---|---|
| 1980's | 131,749 | 97,253 | 92,735 | 85,690 | 91,975 | 103,771 | 98,035 | 82,266 | 78,809 | |
| 1990's | 97,586 | 100,006 | 105,419 | 104,045 | 92,962 | 88,660 | 73,223 | 79,539 | 78,858 | 78,819 |
| 2000's | 71,762 | 61,677 | 54,914 | 66,375 | 76,259 | 63,662 | 72,311 | 72,629 | 65,502 | 42,485 |
| 2010's | 42,977 | 36,916 | 35,265 | 36,220 | 39,448 | 36,964 | 36,399 | 40,620 | 39,610 | 39,121 |
| 2020's | 35,857 | 35,815 | 34,943 | 32,354 |
| - = No Data Reported; -- = Not Applicable; NA = Not Available; W = Withheld to avoid disclosure of individual company data. |
| Release Date: 6/28/2024 |
| Next Release Date: 8/30/2024 |