|
Download Data (XLS File) |
|
||||||||
|
||||||||
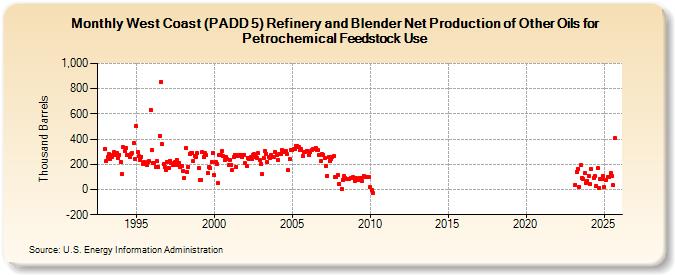
| West Coast (PADD 5) Refinery and Blender Net Production of Other Oils for Petrochemical Feedstock Use (Thousand Barrels) | ||||||||
| Year | Jan | Feb | Mar | Apr | May | Jun | Jul | Aug | Sep | Oct | Nov | Dec |
|---|---|---|---|---|---|---|---|---|---|---|---|---|
| 1993 | 318 | 229 | 256 | 280 | 243 | 259 | 276 | 296 | 272 | 293 | 250 | 276 |
| 1994 | 221 | 123 | 337 | 304 | 328 | 277 | 276 | 256 | 278 | 293 | 371 | 239 |
| 1995 | 501 | 296 | 262 | 238 | 260 | 204 | 218 | 214 | 191 | 221 | 223 | 634 |
| 1996 | 314 | 211 | 214 | 182 | 224 | 175 | 428 | 854 | 358 | 202 | 177 | 156 |
| 1997 | 219 | 172 | 229 | 208 | 192 | 192 | 219 | 238 | 195 | 213 | 175 | 190 |
| 1998 | 149 | 92 | 329 | 141 | 179 | 282 | 288 | 292 | 228 | 263 | 260 | 289 |
| 1999 | 169 | 76 | 72 | 295 | 258 | 286 | 273 | 132 | 181 | 173 | 220 | 289 |
| 2000 | 115 | 218 | 200 | 49 | 270 | 272 | 302 | 264 | 232 | 259 | 240 | 192 |
| 2001 | 237 | 197 | 155 | 259 | 276 | 181 | 263 | 276 | 274 | 256 | 273 | 276 |
| 2002 | 207 | 184 | 252 | 245 | 257 | 243 | 271 | 278 | 255 | 253 | 286 | 233 |
| 2003 | 200 | 122 | 251 | 302 | 285 | 219 | 255 | 252 | 272 | 260 | 260 | 298 |
| 2004 | 271 | 237 | 279 | 279 | 317 | 309 | 301 | 307 | 281 | 151 | 239 | 316 |
| 2005 | 312 | 324 | 325 | 349 | 345 | 334 | 312 | 321 | 266 | 298 | 299 | 307 |
| 2006 | 302 | 271 | 298 | 316 | 318 | 320 | 330 | 317 | 311 | 271 | 223 | 281 |
| 2007 | 274 | 248 | 189 | 110 | 257 | 229 | 244 | 260 | 263 | 97 | 103 | 113 |
| 2008 | 44 | 6 | 75 | 104 | 93 | 84 | 86 | 86 | 91 | 92 | 97 | |
| 2009 | 70 | 95 | 80 | 73 | 92 | 89 | 64 | 111 | 99 | 97 | 96 | 100 |
| 2010 | 16 | -7 | -31 | |||||||||
| 2023 | 38 | 140 | 164 | 21 | 191 | 95 | 82 | 131 | 53 | 69 | ||
| 2024 | 110 | |||||||||||
| - = No Data Reported; -- = Not Applicable; NA = Not Available; W = Withheld to avoid disclosure of individual company data. |
| Release Date: 3/29/2024 |
| Next Release Date: 4/30/2024 |