|
Download Data (XLS File) |
|
||||||||
|
||||||||
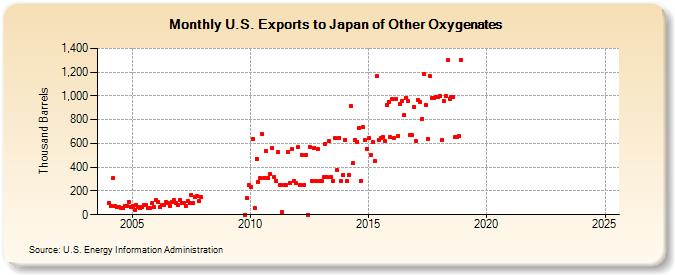
| U.S. Exports to Japan of Other Oxygenates (Thousand Barrels) | ||||||||
| Year | Jan | Feb | Mar | Apr | May | Jun | Jul | Aug | Sep | Oct | Nov | Dec |
|---|---|---|---|---|---|---|---|---|---|---|---|---|
| 2004 | 100 | 77 | 307 | 73 | 63 | 67 | 60 | 54 | 76 | 77 | 110 | 69 |
| 2005 | 73 | 40 | 85 | 69 | 55 | 64 | 79 | 78 | 60 | 56 | 99 | 69 |
| 2006 | 128 | 107 | 67 | 83 | 81 | 110 | 95 | 71 | 109 | 123 | 97 | 82 |
| 2007 | 125 | 95 | 102 | 74 | 113 | 98 | 170 | 98 | 150 | 156 | 113 | 148 |
| 2009 | 1 | 139 | 252 | |||||||||
| 2010 | 235 | 639 | 58 | 473 | 278 | 309 | 681 | 310 | 537 | 310 | 342 | 562 |
| 2011 | 316 | 284 | 524 | 252 | 26 | 253 | 253 | 524 | 271 | 554 | 285 | 263 |
| 2012 | 567 | 253 | 504 | 254 | 505 | 1 | 568 | 285 | 562 | 285 | 549 | 284 |
| 2013 | 284 | 316 | 599 | 316 | 617 | 316 | 284 | 647 | 376 | 649 | 285 | 333 |
| 2014 | 631 | 284 | 334 | 914 | 433 | 630 | 616 | 726 | 284 | 736 | 629 | 555 |
| 2015 | 642 | 503 | 612 | 453 | 1,168 | 633 | 644 | 655 | 617 | 926 | 952 | 651 |
| 2016 | 972 | 644 | 977 | 664 | 935 | 961 | 838 | 985 | 954 | 674 | 669 | 907 |
| 2017 | 620 | 964 | 951 | 804 | 1,188 | 922 | 641 | 1,165 | 984 | 981 | 987 | 987 |
| 2018 | 1,002 | 632 | 954 | 996 | 1,300 | 974 | 991 | 993 | 657 | 653 | 660 | 1,303 |
| 2019 | -- | -- | -- | -- | -- | -- | -- | -- | -- | -- | -- | -- |
| 2020 | -- | -- | -- | -- | -- | -- | -- | -- | -- | -- | -- | -- |
| 2021 | -- | -- | -- | -- | -- | -- | -- | -- | -- | -- | -- | |
| 2022 | -- | -- | -- | -- | -- | -- | -- | -- | -- | -- | -- | -- |
| 2023 | -- | -- | -- | -- | -- | -- | -- | -- | -- | -- | -- | -- |
| 2024 | -- | |||||||||||
| - = No Data Reported; -- = Not Applicable; NA = Not Available; W = Withheld to avoid disclosure of individual company data. |
| Release Date: 3/29/2024 |
| Next Release Date: 4/30/2024 |