|
Download Data (XLS File) |
|
||||||||
|
||||||||
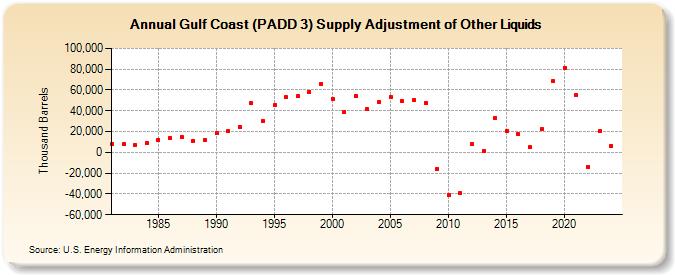
| Gulf Coast (PADD 3) Supply Adjustment of Other Liquids (Thousand Barrels) | ||||||||
| Decade | Year-0 | Year-1 | Year-2 | Year-3 | Year-4 | Year-5 | Year-6 | Year-7 | Year-8 | Year-9 |
|---|---|---|---|---|---|---|---|---|---|---|
| 1980's | 7,991 | 7,682 | 7,238 | 9,081 | 12,156 | 14,153 | 14,890 | 10,889 | 11,663 | |
| 1990's | 18,807 | 20,181 | 24,728 | 47,200 | 30,209 | 45,192 | 52,897 | 53,772 | 58,528 | 65,965 |
| 2000's | 51,384 | 39,217 | 54,213 | 41,382 | 48,006 | 53,376 | 49,325 | 50,420 | 47,354 | -15,869 |
| 2010's | -41,002 | -39,419 | 7,732 | 1,307 | 33,223 | 20,919 | 17,317 | 4,865 | 22,441 | 68,530 |
| 2020's | 81,145 | 55,105 | -13,820 | 21,113 |
| - = No Data Reported; -- = Not Applicable; NA = Not Available; W = Withheld to avoid disclosure of individual company data. |
| Release Date: 3/29/2024 |
| Next Release Date: 8/30/2024 |