|
Download Data (XLS File) |
|
||||||||
|
||||||||
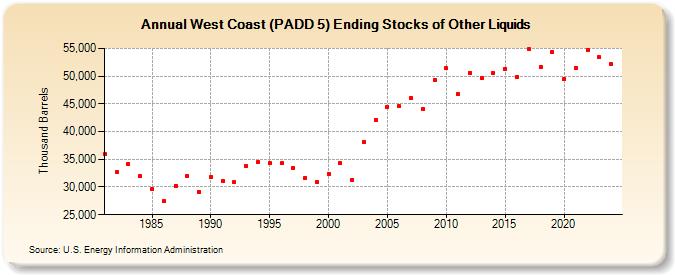
| West Coast (PADD 5) Ending Stocks of Other Liquids (Thousand Barrels) | ||||||||
| Decade | Year-0 | Year-1 | Year-2 | Year-3 | Year-4 | Year-5 | Year-6 | Year-7 | Year-8 | Year-9 |
|---|---|---|---|---|---|---|---|---|---|---|
| 1980's | 35,878 | 32,628 | 34,120 | 31,902 | 29,599 | 27,448 | 30,228 | 31,947 | 29,162 | |
| 1990's | 31,813 | 31,046 | 30,842 | 33,806 | 34,420 | 34,248 | 34,263 | 33,488 | 31,635 | 30,825 |
| 2000's | 32,430 | 34,302 | 31,331 | 38,098 | 42,170 | 44,517 | 44,560 | 46,010 | 44,043 | 49,352 |
| 2010's | 51,410 | 46,756 | 50,614 | 49,703 | 50,491 | 51,286 | 49,909 | 54,835 | 51,717 | 54,337 |
| 2020's | 49,449 | 51,500 | 54,763 | 53,409 |
| - = No Data Reported; -- = Not Applicable; NA = Not Available; W = Withheld to avoid disclosure of individual company data. |
| Release Date: 3/29/2024 |
| Next Release Date: 8/30/2024 |