|
Download Data (XLS File) |
|
||||||||
|
||||||||
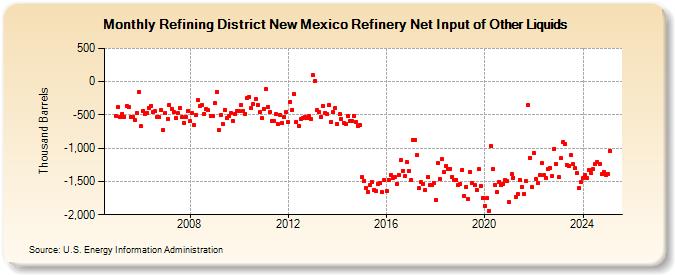
| Refining District New Mexico Refinery Net Input of Other Liquids (Thousand Barrels) | ||||||||
| Year | Jan | Feb | Mar | Apr | May | Jun | Jul | Aug | Sep | Oct | Nov | Dec |
|---|---|---|---|---|---|---|---|---|---|---|---|---|
| 2005 | -521 | -383 | -530 | -480 | -524 | -363 | -387 | -534 | -538 | -581 | -474 | -154 |
| 2006 | -673 | -437 | -490 | -464 | -395 | -362 | -451 | -448 | -537 | -537 | -427 | -723 |
| 2007 | -478 | -562 | -350 | -404 | -463 | -546 | -478 | -402 | -536 | -614 | -532 | -441 |
| 2008 | -597 | -473 | -654 | -508 | -283 | -359 | -351 | -482 | -414 | -432 | -516 | -516 |
| 2009 | -322 | -148 | -732 | -494 | -638 | -424 | -550 | -509 | -472 | -586 | -488 | -444 |
| 2010 | -443 | -348 | -446 | -480 | -239 | -230 | -397 | -341 | -256 | -350 | -462 | -548 |
| 2011 | -409 | -116 | -384 | -457 | -591 | -585 | -491 | -640 | -501 | -617 | -536 | -450 |
| 2012 | -607 | -300 | -426 | -193 | -601 | -664 | -562 | -546 | -528 | -549 | -518 | -555 |
| 2013 | 94 | 14 | -429 | -451 | -525 | -361 | -468 | -493 | -351 | -605 | -462 | -398 |
| 2014 | -633 | -492 | -565 | -620 | -632 | -510 | -593 | -588 | -519 | -606 | -662 | -653 |
| 2015 | -1,432 | -1,486 | -1,592 | -1,658 | -1,557 | -1,509 | -1,622 | -1,651 | -1,539 | -1,527 | -1,664 | -1,480 |
| 2016 | -1,648 | -1,474 | -1,410 | -1,448 | -1,427 | -1,539 | -1,396 | -1,180 | -1,336 | -1,422 | -1,214 | -1,338 |
| 2017 | -1,478 | -872 | -876 | -1,106 | -1,600 | -1,510 | -1,532 | -1,625 | -1,426 | -1,557 | -1,547 | -1,517 |
| 2018 | -1,775 | -1,226 | -1,458 | -1,164 | -1,362 | -1,265 | -1,306 | -1,309 | -1,431 | -1,477 | -1,473 | -1,557 |
| 2019 | -1,539 | -1,323 | -1,720 | -1,582 | -1,764 | -1,356 | -1,530 | -1,560 | -1,626 | -1,317 | -1,562 | -1,742 |
| 2020 | -1,868 | -1,755 | -1,939 | -969 | -1,318 | -1,553 | -1,660 | -1,501 | -1,558 | -1,534 | -1,478 | -1,496 |
| 2021 | -1,815 | -1,392 | -1,444 | -1,731 | -1,694 | -1,474 | -1,579 | -1,688 | -1,494 | -355 | -1,141 | -1,586 |
| 2022 | -1,070 | -1,459 | -1,518 | -1,405 | -1,223 | -1,405 | -1,452 | -1,312 | -1,295 | -1,420 | -1,008 | -1,245 |
| 2023 | -1,437 | -1,152 | -911 | -942 | -1,247 | -1,268 | -1,101 | -1,244 | -1,304 | -1,380 | -1,594 | -1,509 |
| 2024 | -1,449 | -1,404 | -1,445 | -1,335 | -1,378 | -1,320 | ||||||
| - = No Data Reported; -- = Not Applicable; NA = Not Available; W = Withheld to avoid disclosure of individual company data. |
| Release Date: 8/30/2024 |
| Next Release Date: 9/30/2024 |
Referring Pages: