|
Download Data (XLS File) |
|
||||||||
|
||||||||
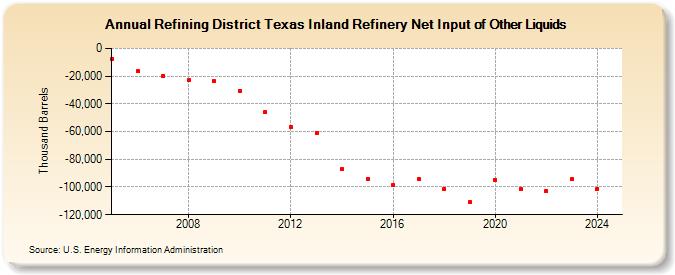
| Refining District Texas Inland Refinery Net Input of Other Liquids (Thousand Barrels) | ||||||||
| Decade | Year-0 | Year-1 | Year-2 | Year-3 | Year-4 | Year-5 | Year-6 | Year-7 | Year-8 | Year-9 |
|---|---|---|---|---|---|---|---|---|---|---|
| 2000's | -7,602 | -16,554 | -19,588 | -22,848 | -23,658 | |||||
| 2010's | -30,576 | -45,999 | -56,456 | -60,750 | -87,011 | -94,327 | -98,662 | -94,164 | -101,322 | -111,067 |
| 2020's | -94,995 | -101,535 | -102,952 | -94,403 |
| - = No Data Reported; -- = Not Applicable; NA = Not Available; W = Withheld to avoid disclosure of individual company data. |
| Release Date: 8/30/2024 |
| Next Release Date: 8/29/2025 |
Referring Pages: