|
Download Data (XLS File) |
|
||||||||
|
||||||||
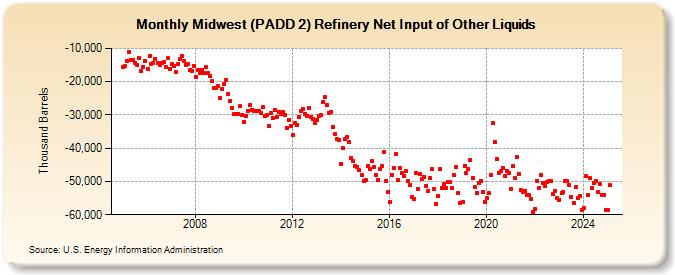
| Midwest (PADD 2) Refinery Net Input of Other Liquids (Thousand Barrels) | ||||||||
| Year | Jan | Feb | Mar | Apr | May | Jun | Jul | Aug | Sep | Oct | Nov | Dec |
|---|---|---|---|---|---|---|---|---|---|---|---|---|
| 2005 | -15,469 | -15,344 | -13,833 | -11,026 | -13,527 | -13,480 | -14,477 | -14,848 | -12,779 | -16,752 | -15,608 | -13,781 |
| 2006 | -16,141 | -12,358 | -14,639 | -14,445 | -13,054 | -14,376 | -14,859 | -14,376 | -13,943 | -15,446 | -12,924 | -16,047 |
| 2007 | -14,741 | -15,159 | -17,015 | -14,764 | -13,212 | -12,157 | -13,660 | -14,980 | -14,753 | -16,597 | -16,815 | -15,307 |
| 2008 | -18,667 | -16,497 | -17,402 | -16,458 | -17,476 | -15,696 | -17,359 | -18,401 | -19,904 | -21,779 | -21,889 | -21,453 |
| 2009 | -24,828 | -22,156 | -20,590 | -19,503 | -23,844 | -25,890 | -27,771 | -29,679 | -29,831 | -29,611 | -27,415 | -30,028 |
| 2010 | -32,081 | -30,196 | -28,726 | -27,005 | -28,404 | -28,823 | -28,935 | -28,756 | -29,415 | -27,650 | -30,259 | -30,028 |
| 2011 | -33,282 | -29,335 | -30,784 | -28,586 | -30,713 | -29,004 | -29,716 | -29,154 | -30,155 | -33,847 | -31,400 | -33,322 |
| 2012 | -36,100 | -32,538 | -33,021 | -30,759 | -28,940 | -28,345 | -29,630 | -30,380 | -27,905 | -30,484 | -31,368 | -32,579 |
| 2013 | -31,497 | -30,377 | -30,080 | -26,023 | -24,599 | -27,001 | -29,305 | -29,153 | -33,741 | -35,856 | -37,279 | -37,638 |
| 2014 | -44,739 | -40,049 | -37,162 | -36,643 | -38,057 | -42,803 | -43,862 | -45,340 | -45,520 | -46,678 | -48,096 | -49,768 |
| 2015 | -49,581 | -45,249 | -46,167 | -43,982 | -45,788 | -48,049 | -49,652 | -46,222 | -45,313 | -41,253 | -49,776 | -53,026 |
| 2016 | -56,231 | -48,057 | -45,837 | -41,830 | -49,480 | -45,975 | -47,604 | -48,214 | -46,965 | -49,734 | -51,117 | -54,552 |
| 2017 | -55,129 | -47,339 | -52,266 | -47,887 | -49,302 | -48,694 | -51,268 | -52,867 | -49,018 | -46,333 | -52,352 | -56,632 |
| 2018 | -54,357 | -46,353 | -52,050 | -50,744 | -52,078 | -50,310 | -50,231 | -51,939 | -48,198 | -45,666 | -53,359 | -56,605 |
| 2019 | -56,126 | -45,206 | -47,584 | -46,369 | -43,419 | -48,970 | -51,644 | -53,450 | -50,589 | -49,910 | -53,122 | -56,208 |
| 2020 | -55,055 | -53,571 | -48,064 | -32,333 | -38,185 | -43,215 | -47,362 | -46,765 | -46,096 | -48,329 | -46,733 | -47,539 |
| 2021 | -52,249 | -45,347 | -49,057 | -42,773 | -47,900 | -52,651 | -53,032 | -52,851 | -54,082 | -54,205 | -55,239 | -59,167 |
| 2022 | -58,214 | -49,958 | -51,902 | -48,165 | -50,392 | -51,510 | -50,037 | -49,715 | -49,905 | -53,788 | -52,823 | -55,004 |
| 2023 | -55,472 | -53,464 | -53,265 | -50,000 | -49,917 | -50,970 | -54,561 | -56,353 | -51,729 | -55,058 | -54,238 | -58,595 |
| 2024 | -58,062 | |||||||||||
| - = No Data Reported; -- = Not Applicable; NA = Not Available; W = Withheld to avoid disclosure of individual company data. |
| Release Date: 3/29/2024 |
| Next Release Date: 4/30/2024 |
Referring Pages: