|
Download Data (XLS File) |
|
||||||||
|
||||||||
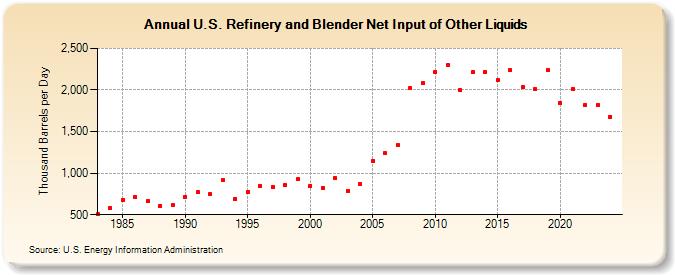
| U.S. Refinery and Blender Net Input of Other Liquids (Thousand Barrels per Day) | ||||||||
| Decade | Year-0 | Year-1 | Year-2 | Year-3 | Year-4 | Year-5 | Year-6 | Year-7 | Year-8 | Year-9 |
|---|---|---|---|---|---|---|---|---|---|---|
| 1980's | 505 | 581 | 681 | 711 | 667 | 610 | 613 | |||
| 1990's | 713 | 768 | 745 | 917 | 691 | 775 | 843 | 832 | 853 | 927 |
| 2000's | 849 | 825 | 941 | 791 | 866 | 1,149 | 1,238 | 1,337 | 2,019 | 2,082 |
| 2010's | 2,219 | 2,300 | 1,997 | 2,211 | 2,214 | 2,119 | 2,238 | 2,031 | 2,011 | 2,237 |
| 2020's | 1,846 | 2,011 | 1,819 | 1,828 |
| - = No Data Reported; -- = Not Applicable; NA = Not Available; W = Withheld to avoid disclosure of individual company data. |
| Release Date: 3/29/2024 |
| Next Release Date: 8/30/2024 |