|
Download Data (XLS File) |
|
||||||||
|
||||||||
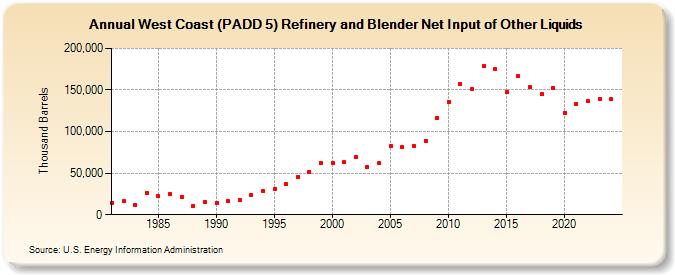
| West Coast (PADD 5) Refinery and Blender Net Input of Other Liquids (Thousand Barrels) | ||||||||
| Decade | Year-0 | Year-1 | Year-2 | Year-3 | Year-4 | Year-5 | Year-6 | Year-7 | Year-8 | Year-9 |
|---|---|---|---|---|---|---|---|---|---|---|
| 1980's | 14,624 | 16,471 | 12,240 | 26,607 | 21,950 | 24,863 | 21,789 | 10,574 | 15,358 | |
| 1990's | 13,954 | 15,951 | 18,044 | 24,137 | 28,291 | 31,317 | 36,769 | 45,817 | 51,765 | 62,237 |
| 2000's | 62,267 | 62,875 | 69,264 | 57,710 | 61,750 | 82,793 | 81,100 | 82,695 | 88,835 | 116,105 |
| 2010's | 135,885 | 157,508 | 151,540 | 178,275 | 174,632 | 148,061 | 166,369 | 153,287 | 144,932 | 152,076 |
| 2020's | 122,735 | 133,425 | 136,361 | 139,640 |
| - = No Data Reported; -- = Not Applicable; NA = Not Available; W = Withheld to avoid disclosure of individual company data. |
| Release Date: 3/29/2024 |
| Next Release Date: 8/30/2024 |