|
Download Data (XLS File) |
|
||||||||
|
||||||||
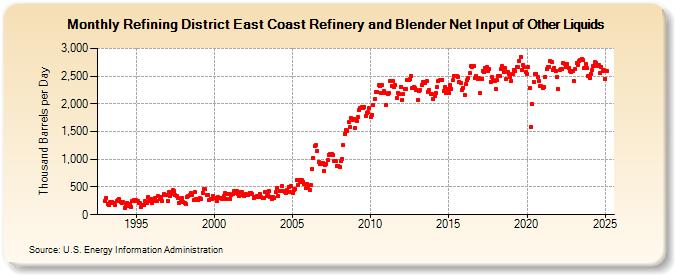
| Refining District East Coast Refinery and Blender Net Input of Other Liquids (Thousand Barrels per Day) | ||||||||
| Year | Jan | Feb | Mar | Apr | May | Jun | Jul | Aug | Sep | Oct | Nov | Dec |
|---|---|---|---|---|---|---|---|---|---|---|---|---|
| 1993 | 256 | 306 | 197 | 169 | 228 | 224 | 203 | 205 | 172 | 241 | 268 | 283 |
| 1994 | 223 | 215 | 221 | 122 | 163 | 219 | 151 | 193 | 148 | 247 | 260 | 254 |
| 1995 | 264 | 251 | 206 | 206 | 148 | 178 | 174 | 240 | 208 | 317 | 248 | 281 |
| 1996 | 219 | 270 | 297 | 252 | 255 | 334 | 292 | 320 | 246 | 382 | 363 | 349 |
| 1997 | 255 | 417 | 340 | 380 | 440 | 423 | 351 | 335 | 308 | 208 | 225 | 301 |
| 1998 | 235 | 208 | 192 | 324 | 338 | 348 | 388 | 359 | 269 | 405 | 278 | 261 |
| 1999 | 275 | 297 | 281 | 400 | 466 | 455 | 356 | 359 | 262 | 287 | 282 | 334 |
| 2000 | 310 | 310 | 255 | 312 | 309 | 299 | 284 | 333 | 388 | 285 | 369 | 379 |
| 2001 | 291 | 355 | 366 | 421 | 389 | 430 | 380 | 334 | 406 | 413 | 360 | 343 |
| 2002 | 372 | 360 | 347 | 400 | 397 | 373 | 304 | 324 | 315 | 345 | 323 | 372 |
| 2003 | 320 | 307 | 303 | 413 | 336 | 352 | 425 | 311 | 287 | 317 | 297 | 408 |
| 2004 | 488 | 344 | 432 | 436 | 515 | 423 | 414 | 388 | 451 | 505 | 412 | 512 |
| 2005 | 384 | 440 | 456 | 631 | 538 | 633 | 588 | 620 | 590 | 546 | 483 | 557 |
| 2006 | 508 | 448 | 534 | 832 | 1,030 | 1,231 | 1,258 | 1,148 | 954 | 917 | 906 | 935 |
| 2007 | 794 | 903 | 922 | 985 | 1,077 | 1,094 | 1,091 | 1,079 | 977 | 963 | 886 | 887 |
| 2008 | 863 | 963 | 1,008 | 1,256 | 1,461 | 1,530 | 1,510 | 1,667 | 1,584 | 1,747 | 1,717 | 1,720 |
| 2009 | 1,572 | 1,696 | 1,755 | 1,883 | 1,923 | 1,938 | 1,918 | 1,943 | 1,777 | 1,836 | 1,848 | 1,918 |
| 2010 | 1,754 | 1,804 | 1,976 | 2,085 | 2,215 | 2,212 | 2,332 | 2,318 | 2,197 | 2,334 | 2,235 | 2,191 |
| 2011 | 1,977 | 2,185 | 2,204 | 2,414 | 2,323 | 2,408 | 2,300 | 2,340 | 2,109 | 2,199 | 2,184 | 2,303 |
| 2012 | 2,078 | 2,175 | 2,273 | 2,271 | 2,434 | 2,424 | 2,442 | 2,504 | 2,281 | 2,298 | 2,277 | 2,256 |
| 2013 | 2,071 | 2,239 | 2,247 | 2,344 | 2,399 | 2,390 | 2,383 | 2,406 | 2,219 | 2,248 | 2,181 | 2,173 |
| 2014 | 2,085 | 2,148 | 2,204 | 2,300 | 2,406 | 2,422 | 2,425 | 2,430 | 2,233 | 2,300 | 2,187 | 2,259 |
| 2015 | 2,191 | 2,337 | 2,274 | 2,421 | 2,498 | 2,501 | 2,493 | 2,491 | 2,400 | 2,382 | 2,248 | 2,291 |
| 2016 | 2,164 | 2,353 | 2,422 | 2,470 | 2,549 | 2,675 | 2,669 | 2,679 | 2,470 | 2,499 | 2,446 | 2,465 |
| 2017 | 2,200 | 2,455 | 2,591 | 2,573 | 2,639 | 2,668 | 2,600 | 2,632 | 2,400 | 2,482 | 2,431 | 2,408 |
| 2018 | 2,269 | 2,421 | 2,508 | 2,496 | 2,621 | 2,682 | 2,571 | 2,644 | 2,442 | 2,581 | 2,537 | 2,492 |
| 2019 | 2,413 | 2,543 | 2,617 | 2,587 | 2,673 | 2,659 | 2,779 | 2,849 | 2,610 | 2,702 | 2,663 | 2,572 |
| 2020 | 2,532 | 2,659 | 2,285 | 1,586 | 1,999 | 2,401 | 2,531 | 2,546 | 2,477 | 2,415 | 2,326 | 2,313 |
| 2021 | 2,279 | 2,296 | 2,491 | 2,620 | 2,662 | 2,673 | 2,764 | 2,758 | 2,612 | 2,653 | 2,590 | 2,487 |
| 2022 | 2,270 | 2,614 | 2,629 | 2,637 | 2,740 | 2,723 | 2,656 | 2,719 | 2,644 | 2,592 | 2,582 | 2,599 |
| 2023 | 2,403 | 2,625 | 2,744 | 2,703 | 2,773 | 2,799 | 2,805 | 2,790 | 2,652 | 2,725 | 2,641 | 2,493 |
| 2024 | 2,467 | 2,547 | 2,618 | 2,685 | ||||||||
| - = No Data Reported; -- = Not Applicable; NA = Not Available; W = Withheld to avoid disclosure of individual company data. |
| Release Date: 6/28/2024 |
| Next Release Date: 7/31/2024 |