|
Download Data (XLS File) |
|
||||||||
|
||||||||
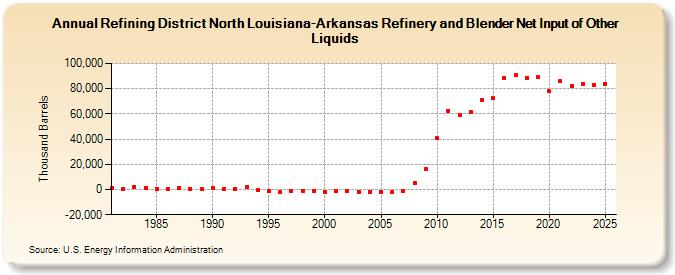
| Refining District North Louisiana-Arkansas Refinery and Blender Net Input of Other Liquids (Thousand Barrels) | ||||||||
| Decade | Year-0 | Year-1 | Year-2 | Year-3 | Year-4 | Year-5 | Year-6 | Year-7 | Year-8 | Year-9 |
|---|---|---|---|---|---|---|---|---|---|---|
| 1980's | 1,142 | 685 | 2,309 | 1,224 | 781 | 384 | 1,325 | 589 | 561 | |
| 1990's | 875 | 445 | 548 | 1,843 | -285 | -1,433 | -1,928 | -1,544 | -927 | -1,202 |
| 2000's | -1,972 | -1,350 | -1,282 | -1,794 | -1,739 | -2,017 | -1,740 | -1,349 | 5,424 | 16,183 |
| 2010's | 40,574 | 62,371 | 59,513 | 61,775 | 71,174 | 72,220 | 88,281 | 90,649 | 88,826 | 88,965 |
| 2020's | 77,810 | 86,004 | 82,059 | 83,680 |
| - = No Data Reported; -- = Not Applicable; NA = Not Available; W = Withheld to avoid disclosure of individual company data. |
| Release Date: 3/29/2024 |
| Next Release Date: 8/30/2024 |