|
Download Data (XLS File) |
|
||||||||
|
||||||||
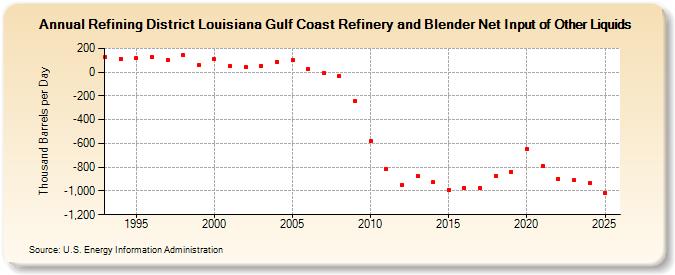
| Refining District Louisiana Gulf Coast Refinery and Blender Net Input of Other Liquids (Thousand Barrels per Day) | ||||||||
| Decade | Year-0 | Year-1 | Year-2 | Year-3 | Year-4 | Year-5 | Year-6 | Year-7 | Year-8 | Year-9 |
|---|---|---|---|---|---|---|---|---|---|---|
| 1990's | 127 | 111 | 118 | 126 | 104 | 141 | 59 | |||
| 2000's | 108 | 52 | 42 | 52 | 88 | 101 | 26 | -8 | -34 | -245 |
| 2010's | -582 | -819 | -949 | -871 | -928 | -990 | -974 | -976 | -875 | -838 |
| 2020's | -649 | -788 | -897 | -910 |
| - = No Data Reported; -- = Not Applicable; NA = Not Available; W = Withheld to avoid disclosure of individual company data. |
| Release Date: 3/29/2024 |
| Next Release Date: 8/30/2024 |