|
Download Data (XLS File) |
|
||||||||
|
||||||||
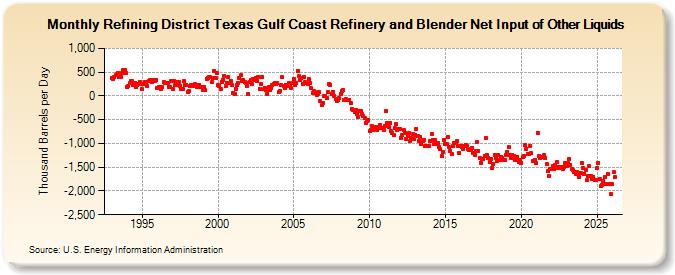
| Refining District Texas Gulf Coast Refinery and Blender Net Input of Other Liquids (Thousand Barrels per Day) | ||||||||
| Year | Jan | Feb | Mar | Apr | May | Jun | Jul | Aug | Sep | Oct | Nov | Dec |
|---|---|---|---|---|---|---|---|---|---|---|---|---|
| 1993 | 370 | 360 | 402 | 437 | 454 | 484 | 393 | 394 | 488 | 536 | 541 | 492 |
| 1994 | 189 | 218 | 265 | 306 | 310 | 232 | 282 | 186 | 221 | 243 | 291 | 256 |
| 1995 | 136 | 259 | 302 | 289 | 203 | 304 | 328 | 344 | 296 | 343 | 307 | 333 |
| 1996 | 156 | 197 | 188 | 151 | 183 | 289 | 278 | 267 | 265 | 191 | 195 | 319 |
| 1997 | 141 | 311 | 222 | 293 | 239 | 289 | 214 | 142 | 140 | 318 | 229 | 234 |
| 1998 | 75 | 111 | 206 | 228 | 216 | 221 | 244 | 194 | 227 | 236 | 193 | 194 |
| 1999 | 122 | 197 | 122 | 347 | 376 | 392 | 388 | 302 | 368 | 522 | 376 | 482 |
| 2000 | 227 | 218 | 154 | 295 | 343 | 423 | 208 | 279 | 392 | 272 | 318 | 232 |
| 2001 | 63 | 34 | 147 | 230 | 271 | 371 | 433 | 307 | 325 | 285 | 282 | 209 |
| 2002 | 46 | 300 | 329 | 246 | 363 | 341 | 384 | 313 | 399 | 144 | 260 | 397 |
| 2003 | 139 | 169 | 115 | 42 | 185 | 118 | 156 | 222 | 261 | 268 | 261 | 268 |
| 2004 | 77 | 113 | 238 | 388 | 207 | 175 | 231 | 212 | 264 | 225 | 160 | 275 |
| 2005 | 357 | 226 | 264 | 520 | 414 | 343 | 383 | 252 | 390 | 290 | 274 | 254 |
| 2006 | 351 | 265 | 161 | 68 | 97 | 73 | 9 | 34 | 83 | -99 | -194 | -144 |
| 2007 | -8 | -4 | -53 | 72 | 258 | 233 | 40 | 91 | 8 | -62 | -107 | -95 |
| 2008 | -54 | 46 | 95 | 116 | -78 | -75 | -94 | -81 | -76 | -154 | -277 | -295 |
| 2009 | -349 | -288 | -387 | -454 | -324 | -324 | -391 | -424 | -473 | -564 | -524 | -503 |
| 2010 | -746 | -719 | -634 | -713 | -701 | -644 | -709 | -682 | -602 | -673 | -682 | -710 |
| 2011 | -640 | -320 | -564 | -654 | -563 | -734 | -779 | -822 | -685 | -597 | -717 | -686 |
| 2012 | -697 | -882 | -814 | -722 | -773 | -905 | -854 | -790 | -945 | -885 | -812 | -916 |
| 2013 | -814 | -691 | -851 | -945 | -860 | -1,006 | -947 | -930 | -1,061 | -1,061 | -1,058 | -1,059 |
| 2014 | -950 | -799 | -926 | -1,016 | -933 | -1,003 | -993 | -1,076 | -1,126 | -1,265 | -1,188 | -918 |
| 2015 | -1,012 | -1,007 | -857 | -1,080 | -1,157 | -1,229 | -1,051 | -982 | -985 | -953 | -1,048 | -1,198 |
| 2016 | -1,055 | -1,085 | -1,109 | -1,046 | -1,033 | -1,047 | -1,119 | -1,148 | -1,139 | -1,096 | -1,203 | -1,236 |
| 2017 | -1,155 | -966 | -1,149 | -1,315 | -1,404 | -1,327 | -1,325 | -1,259 | -878 | -1,236 | -1,310 | -1,385 |
| 2018 | -1,337 | -1,516 | -1,427 | -1,238 | -1,308 | -1,367 | -1,239 | -1,349 | -1,288 | -1,298 | -1,341 | -1,351 |
| 2019 | -1,234 | -1,171 | -1,080 | -1,243 | -1,297 | -1,240 | -1,274 | -1,343 | -1,318 | -1,287 | -1,390 | -1,350 |
| 2020 | -1,406 | -1,296 | -1,255 | -1,040 | -1,111 | -1,219 | -1,231 | -1,047 | -1,210 | -1,369 | -1,377 | -1,341 |
| 2021 | -1,417 | -779 | -1,266 | -1,298 | -1,295 | -1,285 | -1,247 | -1,315 | -1,433 | -1,577 | -1,695 | -1,531 |
| 2022 | -1,533 | -1,470 | -1,529 | -1,447 | -1,396 | -1,519 | -1,504 | -1,517 | -1,504 | -1,541 | -1,506 | -1,405 |
| 2023 | -1,472 | -1,402 | -1,316 | -1,448 | -1,535 | -1,546 | -1,579 | -1,643 | -1,576 | -1,622 | -1,697 | -1,626 |
| 2024 | -1,421 | |||||||||||
| - = No Data Reported; -- = Not Applicable; NA = Not Available; W = Withheld to avoid disclosure of individual company data. |
| Release Date: 3/29/2024 |
| Next Release Date: 4/30/2024 |