|
Download Data (XLS File) |
|
||||||||
|
||||||||
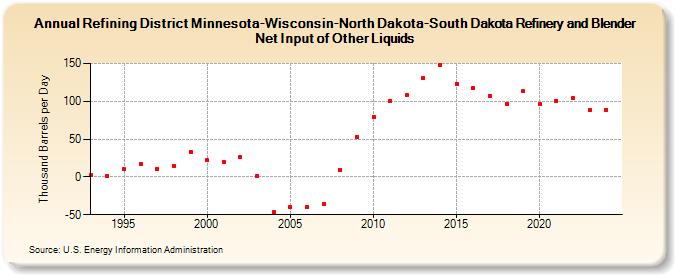
| Refining District Minnesota-Wisconsin-North Dakota-South Dakota Refinery and Blender Net Input of Other Liquids (Thousand Barrels per Day) | ||||||||
| Decade | Year-0 | Year-1 | Year-2 | Year-3 | Year-4 | Year-5 | Year-6 | Year-7 | Year-8 | Year-9 |
|---|---|---|---|---|---|---|---|---|---|---|
| 1990's | 2 | 1 | 10 | 17 | 10 | 15 | 33 | |||
| 2000's | 22 | 20 | 26 | 1 | -47 | -40 | -40 | -36 | 9 | 53 |
| 2010's | 79 | 101 | 108 | 131 | 148 | 123 | 117 | 107 | 97 | 113 |
| 2020's | 96 | 101 | 104 | 89 |
| - = No Data Reported; -- = Not Applicable; NA = Not Available; W = Withheld to avoid disclosure of individual company data. |
| Release Date: 3/29/2024 |
| Next Release Date: 8/30/2024 |