|
Download Data (XLS File) |
|
||||||||
|
||||||||
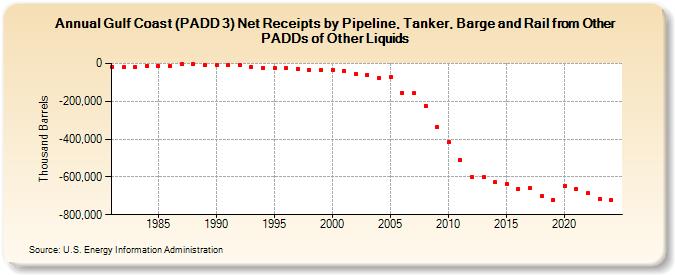
| Gulf Coast (PADD 3) Net Receipts by Pipeline, Tanker, Barge and Rail from Other PADDs of Other Liquids (Thousand Barrels) | ||||||||
| Decade | Year-0 | Year-1 | Year-2 | Year-3 | Year-4 | Year-5 | Year-6 | Year-7 | Year-8 | Year-9 |
|---|---|---|---|---|---|---|---|---|---|---|
| 1980's | -16,693 | -20,374 | -19,183 | -12,485 | -13,112 | -13,319 | -4,338 | -4,575 | -8,204 | |
| 1990's | -6,860 | -8,320 | -10,088 | -17,124 | -22,719 | -24,734 | -26,209 | -28,375 | -32,856 | -34,924 |
| 2000's | -32,470 | -40,437 | -56,093 | -61,341 | -78,897 | -72,554 | -154,678 | -157,564 | -222,521 | -338,055 |
| 2010's | -416,860 | -510,291 | -598,092 | -601,975 | -627,243 | -635,777 | -665,208 | -659,660 | -702,690 | -721,054 |
| 2020's | -646,409 | -664,400 | -686,791 | -718,086 |
| - = No Data Reported; -- = Not Applicable; NA = Not Available; W = Withheld to avoid disclosure of individual company data. |
| Release Date: 3/29/2024 |
| Next Release Date: 8/30/2024 |