|
Download Data (XLS File) |
|
||||||||
|
||||||||
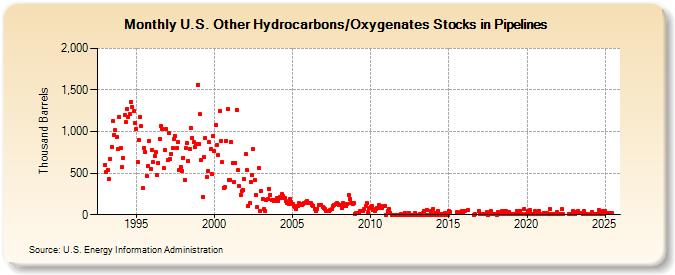
| U.S. Other Hydrocarbons/Oxygenates Stocks in Pipelines (Thousand Barrels) | ||||||||
| Year | Jan | Feb | Mar | Apr | May | Jun | Jul | Aug | Sep | Oct | Nov | Dec |
|---|---|---|---|---|---|---|---|---|---|---|---|---|
| 1993 | 603 | 516 | 540 | 432 | 675 | 818 | 1,124 | 960 | 1,013 | 932 | 793 | 1,173 |
| 1994 | 803 | 573 | 679 | 1,197 | 1,111 | 1,270 | 1,177 | 1,208 | 1,355 | 1,300 | 1,249 | 1,104 |
| 1995 | 1,032 | 628 | 901 | 1,179 | 1,061 | 321 | 797 | 751 | 463 | 584 | 884 | 553 |
| 1996 | 782 | 628 | 704 | 751 | 481 | 622 | 909 | 1,069 | 1,032 | 557 | 778 | 1,033 |
| 1997 | 652 | 977 | 670 | 729 | 802 | 913 | 942 | 801 | 869 | 537 | 578 | 531 |
| 1998 | 685 | 420 | 804 | 862 | 643 | 788 | 1,045 | 926 | 869 | 814 | 854 | 1,564 |
| 1999 | 852 | 1,206 | 662 | 215 | 694 | 925 | 449 | 525 | 871 | 785 | 494 | 943 |
| 2000 | 763 | 1,075 | 842 | 713 | 1,245 | 882 | 629 | 325 | 331 | 890 | 1,269 | 422 |
| 2001 | 422 | 872 | 616 | 396 | 625 | 1,264 | 535 | 347 | 242 | 289 | 299 | 431 |
| 2002 | 732 | 537 | 103 | 139 | 393 | 474 | 788 | 419 | 236 | 88 | 562 | 46 |
| 2003 | 288 | 193 | 63 | 49 | 179 | 188 | 313 | 241 | 173 | 180 | 167 | 174 |
| 2004 | 197 | 160 | 210 | 202 | 251 | 225 | 197 | 159 | 144 | 127 | 184 | 149 |
| 2005 | 131 | 110 | 98 | 67 | 110 | 137 | 126 | 121 | 134 | 135 | 147 | 164 |
| 2006 | 135 | 140 | 137 | 117 | 106 | 68 | 39 | 72 | 115 | 113 | 117 | 98 |
| 2007 | 79 | 65 | 41 | 42 | 40 | 55 | 68 | 100 | 118 | 127 | 135 | 128 |
| 2008 | 114 | 112 | 76 | 143 | 102 | 101 | 129 | 239 | 186 | 137 | 125 | 136 |
| 2009 | 10 | 15 | 26 | 26 | 50 | 41 | 39 | 67 | 104 | 135 | 29 | 82 |
| 2010 | 97 | 110 | 57 | 50 | 67 | 80 | 112 | 109 | 79 | 85 | 103 | 108 |
| 2011 | 1 | 39 | 67 | 26 | 1 | 1 | 1 | 1 | 1 | 1 | 1 | 8 |
| 2012 | 1 | 1 | 26 | 1 | 1 | 23 | 1 | 1 | 1 | 1 | 21 | 1 |
| 2013 | 1 | 1 | 7 | 1 | 15 | 46 | 1 | 60 | 1 | 1 | 48 | 1 |
| 2014 | 72 | 16 | 1 | 1 | 43 | 3 | 1 | 6 | 1 | 20 | 1 | 1 |
| 2015 | 50 | 35 | 29 | 35 | 39 | 20 | ||||||
| 2016 | 44 | 54 | 2 | 3 | 43 | |||||||
| 2017 | 5 | 5 | 3 | 4 | 3 | 33 | 2 | 3 | 49 | 3 | 4 | 3 |
| 2018 | 3 | 2 | 32 | 4 | 4 | 45 | 3 | 49 | 46 | 4 | 38 | 3 |
| 2019 | 4 | 4 | 3 | 4 | 45 | 4 | 3 | 47 | 3 | 66 | 4 | |
| 2020 | 4 | 49 | 51 | 4 | 4 | 4 | 44 | 4 | 5 | 49 | 5 | 5 |
| 2021 | 5 | 21 | 5 | 25 | 4 | 4 | 68 | 4 | 5 | 5 | 4 | 34 |
| 2022 | 5 | 4 | 11 | 64 | 5 | 4 | 5 | 4 | 49 | |||
| 2023 | 4 | 3 | 33 | 39 | 23 | 4 | 39 | 4 | ||||
| - = No Data Reported; -- = Not Applicable; NA = Not Available; W = Withheld to avoid disclosure of individual company data. |
| Release Date: 3/29/2024 |
| Next Release Date: 4/30/2024 |