|
Download Data (XLS File) |
|
||||||||
|
||||||||
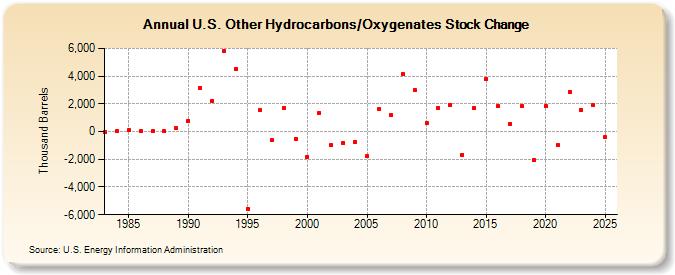
| U.S. Other Hydrocarbons/Oxygenates Stock Change (Thousand Barrels) | ||||||||
| Decade | Year-0 | Year-1 | Year-2 | Year-3 | Year-4 | Year-5 | Year-6 | Year-7 | Year-8 | Year-9 |
|---|---|---|---|---|---|---|---|---|---|---|
| 1980's | -26 | 14 | 85 | 26 | 17 | 21 | 234 | |||
| 1990's | 784 | 3,176 | 2,234 | 5,797 | 4,514 | -5,581 | 1,526 | -639 | 1,679 | -533 |
| 2000's | -1,817 | 1,340 | -984 | -809 | -754 | -1,771 | 1,603 | 1,203 | 4,134 | 2,993 |
| 2010's | 587 | 1,707 | 1,936 | -1,665 | 1,698 | 3,802 | 1,861 | 577 | 1,848 | -2,073 |
| 2020's | 1,846 | -981 | 2,876 | 1,489 |
| - = No Data Reported; -- = Not Applicable; NA = Not Available; W = Withheld to avoid disclosure of individual company data. |
| Release Date: 3/29/2024 |
| Next Release Date: 8/30/2024 |