|
Download Data (XLS File) |
|
||||||||
|
||||||||
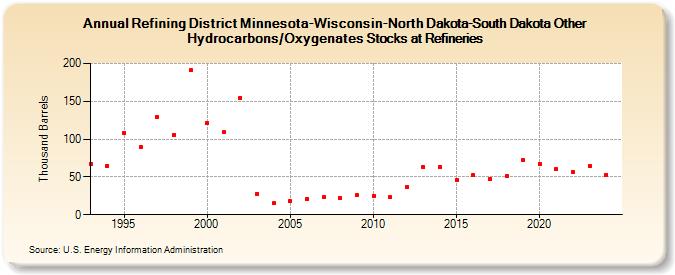
| Refining District Minnesota-Wisconsin-North Dakota-South Dakota Other Hydrocarbons/Oxygenates Stocks at Refineries (Thousand Barrels) | ||||||||
| Decade | Year-0 | Year-1 | Year-2 | Year-3 | Year-4 | Year-5 | Year-6 | Year-7 | Year-8 | Year-9 |
|---|---|---|---|---|---|---|---|---|---|---|
| 1990's | 67 | 65 | 108 | 90 | 129 | 106 | 191 | |||
| 2000's | 121 | 109 | 155 | 28 | 15 | 18 | 21 | 23 | 22 | 26 |
| 2010's | 25 | 23 | 37 | 63 | 63 | 46 | 52 | 47 | 51 | 72 |
| 2020's | 67 | 60 | 56 | 65 |
| - = No Data Reported; -- = Not Applicable; NA = Not Available; W = Withheld to avoid disclosure of individual company data. |
| Release Date: 8/30/2024 |
| Next Release Date: 8/29/2025 |