|
Download Data (XLS File) |
|
||||||||
|
||||||||
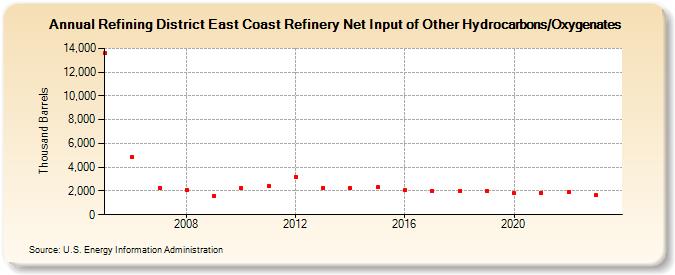
| Refining District East Coast Refinery Net Input of Other Hydrocarbons/Oxygenates (Thousand Barrels) | ||||||||
| Decade | Year-0 | Year-1 | Year-2 | Year-3 | Year-4 | Year-5 | Year-6 | Year-7 | Year-8 | Year-9 |
|---|---|---|---|---|---|---|---|---|---|---|
| 2000's | 13,575 | 4,830 | 2,290 | 2,111 | 1,576 | |||||
| 2010's | 2,229 | 2,399 | 3,207 | 2,275 | 2,238 | 2,307 | 2,049 | 2,010 | 1,973 | 2,005 |
| 2020's | 1,821 | 1,853 | 1,923 | 1,629 |
| - = No Data Reported; -- = Not Applicable; NA = Not Available; W = Withheld to avoid disclosure of individual company data. |
| Release Date: 3/29/2024 |
| Next Release Date: 8/30/2024 |