|
Download Data (XLS File) |
|
||||||||
|
||||||||
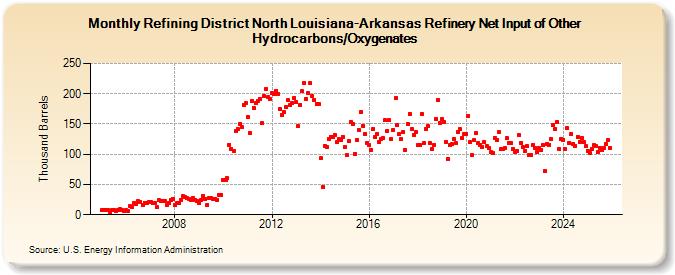
| Refining District North Louisiana-Arkansas Refinery Net Input of Other Hydrocarbons/Oxygenates (Thousand Barrels) | ||||||||
| Year | Jan | Feb | Mar | Apr | May | Jun | Jul | Aug | Sep | Oct | Nov | Dec |
|---|---|---|---|---|---|---|---|---|---|---|---|---|
| 2005 | 7 | 7 | 8 | 7 | 5 | 7 | 7 | 6 | 7 | 9 | 7 | 6 |
| 2006 | 7 | 6 | 14 | 13 | 20 | 18 | 22 | 21 | 16 | 20 | 20 | 21 |
| 2007 | 21 | 19 | 20 | 12 | 24 | 23 | 23 | 22 | 16 | 20 | 25 | 26 |
| 2008 | 16 | 19 | 19 | 25 | 31 | 29 | 28 | 26 | 25 | 28 | 25 | 23 |
| 2009 | 19 | 25 | 31 | 26 | 16 | 28 | 27 | 26 | 26 | 25 | 32 | 33 |
| 2010 | 58 | 57 | 60 | 116 | 109 | 106 | 138 | 142 | 150 | 145 | 182 | 184 |
| 2011 | 161 | 135 | 188 | 177 | 184 | 188 | 191 | 152 | 197 | 208 | 194 | 192 |
| 2012 | 201 | 200 | 205 | 200 | 175 | 165 | 169 | 178 | 189 | 182 | 184 | 193 |
| 2013 | 187 | 146 | 182 | 204 | 218 | 192 | 201 | 217 | 196 | 190 | 183 | 183 |
| 2014 | 93 | 46 | 114 | 112 | 125 | 129 | 128 | 132 | 120 | 125 | 123 | 129 |
| 2015 | 112 | 98 | 122 | 154 | 150 | 101 | 124 | 140 | 170 | 146 | 134 | 119 |
| 2016 | 115 | 107 | 141 | 128 | 134 | 121 | 125 | 126 | 156 | 139 | 156 | 125 |
| 2017 | 140 | 193 | 148 | 134 | 125 | 137 | 107 | 150 | 167 | 141 | 132 | 136 |
| 2018 | 115 | 116 | 167 | 118 | 142 | 147 | 119 | 109 | 116 | 158 | 190 | 151 |
| 2019 | 158 | 153 | 121 | 92 | 115 | 117 | 125 | 118 | 136 | 141 | 127 | 133 |
| 2020 | 134 | 163 | 120 | 98 | 123 | 135 | 118 | 116 | 112 | 120 | 113 | 111 |
| 2021 | 103 | 102 | 127 | 123 | 136 | 108 | 109 | 110 | 127 | 119 | 118 | 109 |
| 2022 | 104 | 106 | 132 | 119 | 112 | 106 | 113 | 98 | 99 | 116 | 111 | 103 |
| 2023 | 111 | 107 | 116 | 72 | 117 | 116 | 125 | 148 | 142 | 153 | 108 | 125 |
| 2024 | 125 | |||||||||||
| - = No Data Reported; -- = Not Applicable; NA = Not Available; W = Withheld to avoid disclosure of individual company data. |
| Release Date: 3/29/2024 |
| Next Release Date: 4/30/2024 |