|
Download Data (XLS File) |
|
||||||||
|
||||||||
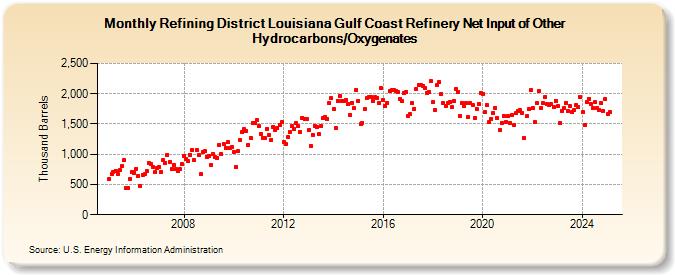
| Refining District Louisiana Gulf Coast Refinery Net Input of Other Hydrocarbons/Oxygenates (Thousand Barrels) | ||||||||
| Year | Jan | Feb | Mar | Apr | May | Jun | Jul | Aug | Sep | Oct | Nov | Dec |
|---|---|---|---|---|---|---|---|---|---|---|---|---|
| 2005 | 593 | 669 | 712 | 726 | 669 | 743 | 806 | 897 | 438 | 438 | 596 | 714 |
| 2006 | 695 | 761 | 644 | 476 | 664 | 665 | 721 | 859 | 834 | 787 | 699 | 772 |
| 2007 | 785 | 705 | 900 | 859 | 993 | 875 | 759 | 814 | 754 | 717 | 749 | 835 |
| 2008 | 976 | 926 | 889 | 995 | 1,065 | 904 | 1,076 | 989 | 666 | 1,033 | 1,048 | 962 |
| 2009 | 978 | 824 | 997 | 954 | 945 | 1,157 | 1,007 | 1,172 | 1,107 | 1,194 | 1,097 | 1,119 |
| 2010 | 1,038 | 785 | 1,046 | 1,233 | 1,363 | 1,412 | 1,385 | 1,154 | 1,276 | 1,518 | 1,520 | 1,563 |
| 2011 | 1,466 | 1,335 | 1,276 | 1,261 | 1,425 | 1,317 | 1,243 | 1,451 | 1,399 | 1,429 | 1,476 | 1,526 |
| 2012 | 1,204 | 1,169 | 1,278 | 1,371 | 1,465 | 1,422 | 1,520 | 1,459 | 1,360 | 1,607 | 1,579 | 1,580 |
| 2013 | 1,396 | 1,139 | 1,326 | 1,465 | 1,455 | 1,329 | 1,464 | 1,597 | 1,618 | 1,589 | 1,847 | 1,922 |
| 2014 | 1,746 | 1,437 | 1,881 | 1,963 | 1,888 | 1,888 | 1,894 | 1,825 | 1,654 | 1,851 | 1,758 | 2,061 |
| 2015 | 1,876 | 1,493 | 1,522 | 1,741 | 1,925 | 1,942 | 1,943 | 1,884 | 1,944 | 1,934 | 1,852 | 2,098 |
| 2016 | 1,890 | 1,804 | 1,851 | 2,039 | 2,061 | 2,069 | 2,051 | 2,023 | 1,912 | 1,881 | 2,011 | 2,035 |
| 2017 | 1,639 | 1,659 | 1,841 | 1,749 | 2,074 | 2,137 | 2,140 | 2,136 | 2,095 | 2,016 | 2,026 | 2,208 |
| 2018 | 1,860 | 1,734 | 2,139 | 2,190 | 1,997 | 1,851 | 1,804 | 1,844 | 1,870 | 1,773 | 1,876 | 2,083 |
| 2019 | 2,035 | 1,635 | 1,852 | 1,804 | 1,850 | 1,609 | 1,841 | 1,819 | 1,595 | 1,753 | 1,834 | 2,010 |
| 2020 | 2,003 | 1,690 | 1,810 | 1,527 | 1,581 | 1,678 | 1,770 | 1,604 | 1,404 | 1,520 | 1,636 | 1,537 |
| 2021 | 1,631 | 1,517 | 1,652 | 1,485 | 1,674 | 1,713 | 1,725 | 1,680 | 1,268 | 1,624 | 1,745 | 2,054 |
| 2022 | 1,762 | 1,533 | 1,849 | 2,044 | 1,760 | 1,840 | 1,943 | 1,833 | 1,810 | 1,822 | 1,786 | 1,884 |
| 2023 | 1,790 | 1,512 | 1,721 | 1,759 | 1,851 | 1,717 | 1,794 | 1,683 | 1,732 | 1,806 | 1,784 | 1,943 |
| 2024 | 1,691 | 1,482 | 1,863 | 1,917 | ||||||||
| - = No Data Reported; -- = Not Applicable; NA = Not Available; W = Withheld to avoid disclosure of individual company data. |
| Release Date: 6/28/2024 |
| Next Release Date: 7/31/2024 |