|
Download Data (XLS File) |
|
||||||||
|
||||||||
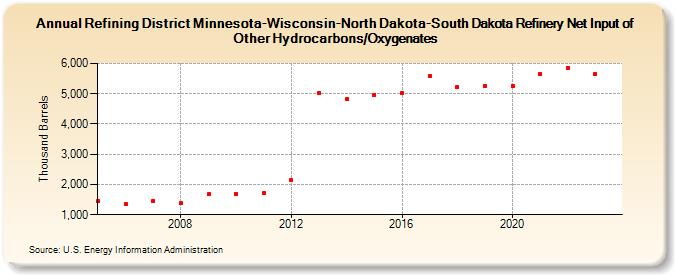
| Refining District Minnesota-Wisconsin-North Dakota-South Dakota Refinery Net Input of Other Hydrocarbons/Oxygenates (Thousand Barrels) | ||||||||
| Decade | Year-0 | Year-1 | Year-2 | Year-3 | Year-4 | Year-5 | Year-6 | Year-7 | Year-8 | Year-9 |
|---|---|---|---|---|---|---|---|---|---|---|
| 2000's | 1,441 | 1,338 | 1,455 | 1,373 | 1,676 | |||||
| 2010's | 1,684 | 1,709 | 2,132 | 5,011 | 4,825 | 4,963 | 5,019 | 5,589 | 5,224 | 5,249 |
| 2020's | 5,267 | 5,644 | 5,855 | 5,655 |
| - = No Data Reported; -- = Not Applicable; NA = Not Available; W = Withheld to avoid disclosure of individual company data. |
| Release Date: 3/29/2024 |
| Next Release Date: 8/30/2024 |