|
Download Data (XLS File) |
|
||||||||
|
||||||||
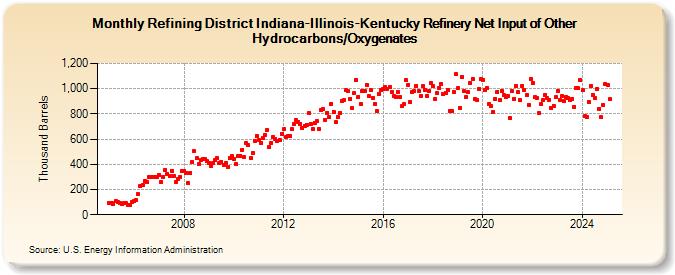
| Refining District Indiana-Illinois-Kentucky Refinery Net Input of Other Hydrocarbons/Oxygenates (Thousand Barrels) | ||||||||
| Year | Jan | Feb | Mar | Apr | May | Jun | Jul | Aug | Sep | Oct | Nov | Dec |
|---|---|---|---|---|---|---|---|---|---|---|---|---|
| 2005 | 91 | 96 | 83 | 106 | 104 | 93 | 85 | 90 | 90 | 76 | 80 | 97 |
| 2006 | 108 | 114 | 162 | 229 | 234 | 267 | 256 | 299 | 299 | 300 | 297 | 303 |
| 2007 | 316 | 262 | 302 | 353 | 326 | 305 | 349 | 311 | 258 | 281 | 300 | 343 |
| 2008 | 348 | 334 | 249 | 333 | 418 | 502 | 448 | 399 | 436 | 446 | 439 | 423 |
| 2009 | 411 | 387 | 408 | 432 | 447 | 410 | 421 | 397 | 414 | 377 | 448 | 463 |
| 2010 | 444 | 403 | 462 | 469 | 516 | 455 | 570 | 552 | 453 | 492 | 587 | 627 |
| 2011 | 596 | 572 | 611 | 636 | 669 | 535 | 570 | 619 | 603 | 586 | 594 | 643 |
| 2012 | 678 | 615 | 621 | 626 | 678 | 723 | 749 | 737 | 723 | 688 | 704 | 715 |
| 2013 | 804 | 723 | 680 | 730 | 743 | 681 | 832 | 836 | 753 | 811 | 777 | 882 |
| 2014 | 817 | 734 | 779 | 810 | 906 | 907 | 987 | 981 | 921 | 848 | 962 | 1,070 |
| 2015 | 937 | 882 | 985 | 981 | 1,031 | 940 | 993 | 929 | 878 | 823 | 960 | 989 |
| 2016 | 995 | 1,013 | 997 | 1,013 | 975 | 941 | 934 | 977 | 936 | 859 | 876 | 1,066 |
| 2017 | 1,032 | 893 | 970 | 980 | 1,023 | 980 | 940 | 1,019 | 993 | 943 | 981 | 1,043 |
| 2018 | 1,021 | 922 | 966 | 1,008 | 1,039 | 956 | 967 | 989 | 825 | 821 | 976 | 1,116 |
| 2019 | 1,004 | 849 | 1,096 | 980 | 937 | 972 | 1,045 | 1,080 | 917 | 912 | 1,000 | 1,073 |
| 2020 | 1,071 | 989 | 1,007 | 877 | 861 | 818 | 922 | 977 | 911 | 984 | 950 | 936 |
| 2021 | 944 | 768 | 978 | 922 | 1,023 | 973 | 908 | 1,025 | 993 | 947 | 874 | 1,076 |
| 2022 | 1,048 | 932 | 930 | 808 | 876 | 908 | 950 | 924 | 912 | 843 | 866 | 931 |
| 2023 | 985 | 910 | 939 | 905 | 936 | 928 | 914 | 922 | 857 | 1,004 | 1,002 | 1,069 |
| 2024 | 987 | 783 | 776 | 898 | 1,024 | 948 | 926 | 997 | 841 | 772 | 872 | 1,041 |
| 2025 | 1,032 | 915 | 1,024 | 1,034 | ||||||||
| - = No Data Reported; -- = Not Applicable; NA = Not Available; W = Withheld to avoid disclosure of individual company data. |
| Release Date: 6/30/2025 |
| Next Release Date: 7/31/2025 |