|
Download Data (XLS File) |
|
||||||||
|
||||||||
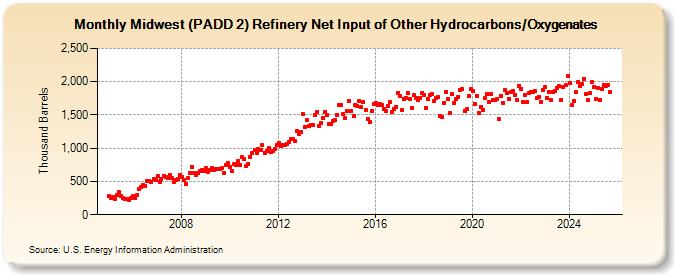
| Midwest (PADD 2) Refinery Net Input of Other Hydrocarbons/Oxygenates (Thousand Barrels) | ||||||||
| Year | Jan | Feb | Mar | Apr | May | Jun | Jul | Aug | Sep | Oct | Nov | Dec |
|---|---|---|---|---|---|---|---|---|---|---|---|---|
| 2005 | 274 | 258 | 259 | 232 | 290 | 334 | 284 | 249 | 231 | 229 | 222 | 257 |
| 2006 | 274 | 253 | 302 | 391 | 418 | 454 | 433 | 502 | 501 | 491 | 531 | 526 |
| 2007 | 584 | 496 | 544 | 578 | 570 | 556 | 604 | 548 | 487 | 524 | 536 | 601 |
| 2008 | 570 | 520 | 469 | 545 | 633 | 720 | 633 | 597 | 630 | 663 | 675 | 660 |
| 2009 | 696 | 635 | 679 | 695 | 674 | 689 | 689 | 681 | 695 | 624 | 753 | 771 |
| 2010 | 720 | 656 | 761 | 751 | 812 | 750 | 865 | 839 | 733 | 767 | 872 | 924 |
| 2011 | 975 | 929 | 983 | 973 | 1,050 | 929 | 965 | 1,006 | 936 | 952 | 985 | 1,044 |
| 2012 | 1,072 | 1,026 | 1,051 | 1,043 | 1,058 | 1,097 | 1,137 | 1,143 | 1,111 | 1,255 | 1,210 | 1,248 |
| 2013 | 1,517 | 1,323 | 1,419 | 1,329 | 1,346 | 1,345 | 1,505 | 1,551 | 1,337 | 1,381 | 1,449 | 1,538 |
| 2014 | 1,502 | 1,360 | 1,360 | 1,407 | 1,418 | 1,506 | 1,648 | 1,651 | 1,511 | 1,453 | 1,552 | 1,706 |
| 2015 | 1,562 | 1,482 | 1,656 | 1,636 | 1,704 | 1,612 | 1,687 | 1,580 | 1,443 | 1,388 | 1,560 | 1,671 |
| 2016 | 1,682 | 1,653 | 1,657 | 1,654 | 1,593 | 1,562 | 1,631 | 1,697 | 1,549 | 1,592 | 1,621 | 1,836 |
| 2017 | 1,786 | 1,580 | 1,741 | 1,755 | 1,827 | 1,738 | 1,611 | 1,792 | 1,757 | 1,731 | 1,752 | 1,832 |
| 2018 | 1,805 | 1,600 | 1,745 | 1,802 | 1,819 | 1,713 | 1,751 | 1,769 | 1,485 | 1,466 | 1,682 | 1,852 |
| 2019 | 1,739 | 1,535 | 1,812 | 1,683 | 1,735 | 1,774 | 1,871 | 1,886 | 1,563 | 1,585 | 1,790 | 1,887 |
| 2020 | 1,864 | 1,669 | 1,789 | 1,525 | 1,626 | 1,577 | 1,753 | 1,811 | 1,692 | 1,810 | 1,729 | 1,731 |
| 2021 | 1,746 | 1,432 | 1,785 | 1,683 | 1,874 | 1,828 | 1,746 | 1,843 | 1,859 | 1,802 | 1,731 | 1,934 |
| 2022 | 1,895 | 1,689 | 1,797 | 1,688 | 1,832 | 1,841 | 1,845 | 1,855 | 1,758 | 1,766 | 1,695 | 1,874 |
| 2023 | 1,917 | 1,756 | 1,843 | 1,721 | 1,837 | 1,861 | 1,910 | 1,928 | 1,723 | 1,922 | 1,943 | 2,079 |
| 2024 | 1,978 | 1,647 | 1,709 | 1,842 | ||||||||
| - = No Data Reported; -- = Not Applicable; NA = Not Available; W = Withheld to avoid disclosure of individual company data. |
| Release Date: 6/28/2024 |
| Next Release Date: 7/31/2024 |