|
Download Data (XLS File) |
|
||||||||
|
||||||||
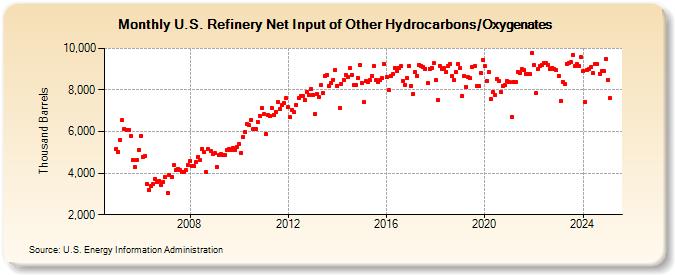
| U.S. Refinery Net Input of Other Hydrocarbons/Oxygenates (Thousand Barrels) | ||||||||
| Year | Jan | Feb | Mar | Apr | May | Jun | Jul | Aug | Sep | Oct | Nov | Dec |
|---|---|---|---|---|---|---|---|---|---|---|---|---|
| 2005 | 5,158 | 5,024 | 5,603 | 6,535 | 6,134 | 6,089 | 6,086 | 5,807 | 4,624 | 4,297 | 4,648 | 5,124 |
| 2006 | 5,776 | 4,786 | 4,848 | 3,471 | 3,180 | 3,361 | 3,465 | 3,719 | 3,560 | 3,640 | 3,445 | 3,585 |
| 2007 | 3,813 | 3,057 | 3,913 | 3,835 | 4,370 | 4,158 | 4,201 | 4,155 | 4,045 | 4,058 | 4,130 | 4,397 |
| 2008 | 4,588 | 4,323 | 4,326 | 4,525 | 4,786 | 4,619 | 5,170 | 5,003 | 4,033 | 5,138 | 5,045 | 4,931 |
| 2009 | 4,954 | 4,314 | 4,856 | 4,913 | 4,878 | 4,884 | 5,089 | 5,150 | 5,133 | 5,216 | 5,132 | 5,278 |
| 2010 | 5,391 | 4,969 | 5,747 | 5,988 | 6,376 | 6,293 | 6,570 | 6,133 | 6,123 | 6,483 | 6,740 | 7,122 |
| 2011 | 6,827 | 5,865 | 6,807 | 6,731 | 7,137 | 6,815 | 6,958 | 7,422 | 7,100 | 7,281 | 7,364 | 7,611 |
| 2012 | 7,168 | 6,681 | 7,016 | 6,932 | 7,269 | 7,600 | 7,717 | 7,716 | 7,524 | 7,922 | 7,773 | 8,042 |
| 2013 | 7,777 | 6,827 | 7,807 | 7,655 | 8,216 | 7,846 | 8,691 | 8,731 | 8,213 | 8,347 | 8,500 | 8,966 |
| 2014 | 8,202 | 7,147 | 8,293 | 8,486 | 8,735 | 8,645 | 9,039 | 8,734 | 8,231 | 8,254 | 8,571 | 9,206 |
| 2015 | 8,325 | 7,398 | 8,422 | 8,393 | 8,476 | 8,691 | 9,143 | 8,471 | 8,369 | 8,497 | 8,561 | 9,246 |
| 2016 | 8,623 | 7,982 | 8,674 | 8,755 | 9,062 | 8,922 | 9,069 | 9,133 | 8,441 | 8,252 | 8,587 | 9,159 |
| 2017 | 8,181 | 7,811 | 8,845 | 8,682 | 9,221 | 9,176 | 9,107 | 9,030 | 8,340 | 9,021 | 9,070 | 9,278 |
| 2018 | 8,456 | 7,504 | 9,165 | 8,989 | 9,054 | 8,888 | 9,166 | 9,269 | 8,678 | 8,486 | 8,850 | 9,269 |
| 2019 | 9,067 | 7,732 | 8,672 | 8,162 | 8,610 | 8,559 | 9,112 | 9,144 | 8,203 | 8,200 | 8,809 | 9,465 |
| 2020 | 9,141 | 8,438 | 8,844 | 7,546 | 7,899 | 7,758 | 8,532 | 8,421 | 7,879 | 8,213 | 8,229 | 8,418 |
| 2021 | 8,363 | 6,717 | 8,379 | 8,402 | 8,881 | 8,811 | 8,985 | 8,941 | 8,790 | 8,781 | 8,767 | 9,799 |
| 2022 | 9,182 | 7,839 | 8,992 | 9,137 | 9,224 | 9,310 | 9,283 | 9,216 | 9,015 | 9,071 | 9,008 | 8,940 |
| 2023 | 8,650 | 7,473 | 8,374 | 8,277 | 9,255 | 9,332 | 9,317 | 9,677 | 9,254 | 9,261 | 9,143 | 9,561 |
| 2024 | 8,890 | |||||||||||
| - = No Data Reported; -- = Not Applicable; NA = Not Available; W = Withheld to avoid disclosure of individual company data. |
| Release Date: 3/29/2024 |
| Next Release Date: 4/30/2024 |