|
Download Data (XLS File) |
|
||||||||
|
||||||||
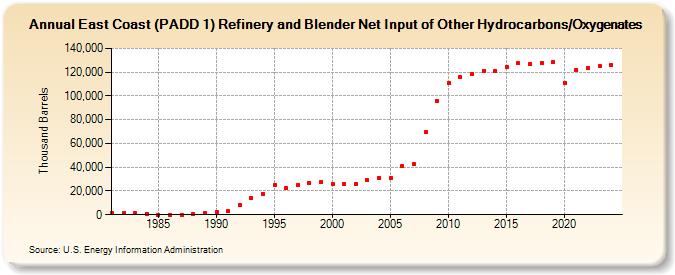
| East Coast (PADD 1) Refinery and Blender Net Input of Other Hydrocarbons/Oxygenates (Thousand Barrels) | ||||||||
| Decade | Year-0 | Year-1 | Year-2 | Year-3 | Year-4 | Year-5 | Year-6 | Year-7 | Year-8 | Year-9 |
|---|---|---|---|---|---|---|---|---|---|---|
| 1980's | 1,293 | 1,561 | 1,070 | 750 | 25 | 103 | 96 | 412 | 1,479 | |
| 1990's | 2,044 | 2,855 | 7,998 | 13,989 | 17,744 | 25,033 | 22,217 | 24,846 | 27,100 | 27,686 |
| 2000's | 25,531 | 25,985 | 25,852 | 28,965 | 31,273 | 31,251 | 40,592 | 42,584 | 69,617 | 95,756 |
| 2010's | 110,767 | 116,074 | 118,558 | 121,293 | 121,374 | 124,154 | 127,386 | 127,172 | 127,529 | 128,377 |
| 2020's | 111,179 | 121,862 | 123,212 | 125,210 |
| - = No Data Reported; -- = Not Applicable; NA = Not Available; W = Withheld to avoid disclosure of individual company data. |
| Release Date: 3/29/2024 |
| Next Release Date: 8/30/2024 |