|
Download Data (XLS File) |
|
||||||||
|
||||||||
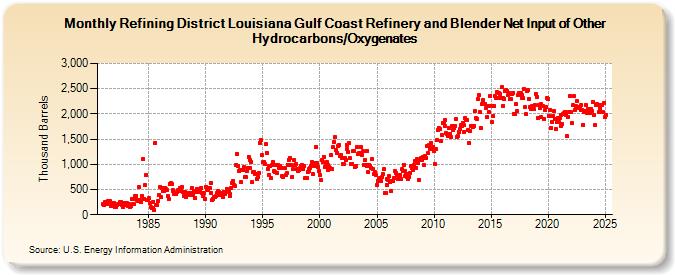
| Refining District Louisiana Gulf Coast Refinery and Blender Net Input of Other Hydrocarbons/Oxygenates (Thousand Barrels) | ||||||||
| Year | Jan | Feb | Mar | Apr | May | Jun | Jul | Aug | Sep | Oct | Nov | Dec |
|---|---|---|---|---|---|---|---|---|---|---|---|---|
| 1981 | 203 | 185 | 249 | 237 | 208 | 270 | 256 | 263 | 170 | 210 | 242 | 225 |
| 1982 | 151 | 148 | 162 | 187 | 210 | 207 | 249 | 252 | 195 | 144 | 223 | 196 |
| 1983 | 189 | 230 | 180 | 209 | 153 | 175 | 304 | 205 | 206 | 313 | 366 | 376 |
| 1984 | 285 | 273 | 540 | 289 | 246 | 376 | 1,101 | 314 | 586 | 779 | 282 | 299 |
| 1985 | 326 | 233 | 153 | 140 | 134 | 261 | 93 | 1,426 | 200 | 188 | 268 | 395 |
| 1986 | 556 | 348 | 525 | 477 | 471 | 528 | 517 | 493 | 367 | 314 | 618 | 622 |
| 1987 | 609 | 485 | 467 | 401 | 418 | 403 | 455 | 485 | 472 | 528 | 462 | 541 |
| 1988 | 455 | 377 | 458 | 351 | 436 | 393 | 392 | 421 | 423 | 529 | 412 | 394 |
| 1989 | 473 | 338 | 452 | 511 | 462 | 446 | 458 | 527 | 440 | 378 | 427 | 318 |
| 1990 | 559 | 507 | 484 | 535 | 524 | 637 | 434 | 284 | 305 | 345 | 345 | 375 |
| 1991 | 427 | 465 | 445 | 382 | 407 | 430 | 356 | 456 | 411 | 446 | 516 | 487 |
| 1992 | 478 | 364 | 408 | 532 | 639 | 663 | 599 | 561 | 992 | 1,214 | 972 | 864 |
| 1993 | 892 | 653 | 895 | 890 | 949 | 744 | 742 | 861 | 929 | 1,146 | 927 | 1,088 |
| 1994 | 1,049 | 646 | 848 | 846 | 811 | 810 | 700 | 756 | 830 | 1,424 | 1,487 | 1,182 |
| 1995 | 1,036 | 1,052 | 1,005 | 1,396 | 1,233 | 902 | 959 | 785 | 961 | 719 | 978 | 1,041 |
| 1996 | 866 | 847 | 988 | 834 | 980 | 926 | 969 | 935 | 765 | 739 | 920 | 936 |
| 1997 | 789 | 819 | 996 | 1,095 | 991 | 1,123 | 984 | 756 | 908 | 1,081 | 979 | 999 |
| 1998 | 897 | 863 | 879 | 917 | 975 | 988 | 916 | 959 | 720 | 733 | 724 | 850 |
| 1999 | 904 | 861 | 924 | 967 | 1,036 | 806 | 1,030 | 962 | 1,350 | 1,020 | 952 | 868 |
| 2000 | 789 | 690 | 1,094 | 1,038 | 1,150 | 948 | 1,024 | 1,041 | 996 | 890 | 945 | 926 |
| 2001 | 1,177 | 910 | 1,337 | 1,443 | 1,536 | 1,282 | 1,230 | 1,359 | 1,385 | 1,173 | 1,187 | 1,134 |
| 2002 | 1,015 | 1,013 | 1,118 | 1,093 | 1,392 | 1,295 | 1,241 | 1,419 | 1,119 | 997 | 1,011 | 1,272 |
| 2003 | 1,266 | 955 | 973 | 1,343 | 1,209 | 1,216 | 1,234 | 1,353 | 1,188 | 1,254 | 995 | 1,085 |
| 2004 | 984 | 966 | 1,272 | 842 | 982 | 975 | 925 | 1,110 | 897 | 807 | 842 | 783 |
| 2005 | 593 | 669 | 712 | 726 | 669 | 743 | 806 | 897 | 438 | 438 | 596 | 714 |
| 2006 | 695 | 761 | 644 | 476 | 664 | 665 | 721 | 859 | 834 | 787 | 699 | 772 |
| 2007 | 785 | 705 | 900 | 859 | 993 | 875 | 759 | 814 | 754 | 717 | 749 | 835 |
| 2008 | 976 | 926 | 889 | 996 | 1,067 | 918 | 1,105 | 1,024 | 689 | 1,090 | 1,116 | 1,092 |
| 2009 | 1,149 | 980 | 1,164 | 1,126 | 1,133 | 1,365 | 1,218 | 1,381 | 1,310 | 1,427 | 1,321 | 1,348 |
| 2010 | 1,256 | 999 | 1,297 | 1,491 | 1,680 | 1,722 | 1,700 | 1,465 | 1,583 | 1,820 | 1,812 | 1,875 |
| 2011 | 1,756 | 1,619 | 1,594 | 1,557 | 1,723 | 1,611 | 1,543 | 1,761 | 1,689 | 1,728 | 1,762 | 1,907 |
| 2012 | 1,541 | 1,570 | 1,633 | 1,695 | 1,777 | 1,760 | 1,820 | 1,771 | 1,650 | 1,916 | 1,880 | 1,883 |
| 2013 | 1,688 | 1,430 | 1,657 | 1,768 | 1,765 | 1,733 | 1,764 | 2,049 | 1,911 | 1,908 | 2,291 | 2,367 |
| 2014 | 2,032 | 1,719 | 2,194 | 2,274 | 2,217 | 2,190 | 2,196 | 2,126 | 1,945 | 2,156 | 2,035 | 2,355 |
| 2015 | 2,164 | 1,839 | 1,958 | 2,160 | 2,357 | 2,324 | 2,425 | 2,320 | 2,422 | 2,404 | 2,317 | 2,524 |
| 2016 | 2,321 | 2,166 | 2,298 | 2,456 | 2,467 | 2,454 | 2,365 | 2,413 | 2,304 | 2,293 | 2,385 | 2,422 |
| 2017 | 2,005 | 2,001 | 2,194 | 2,049 | 2,369 | 2,408 | 2,421 | 2,424 | 2,375 | 2,307 | 2,306 | 2,492 |
| 2018 | 2,130 | 1,988 | 2,453 | 2,478 | 2,300 | 2,136 | 2,095 | 2,148 | 2,154 | 2,088 | 2,177 | 2,390 |
| 2019 | 2,334 | 1,919 | 2,179 | 2,116 | 2,191 | 1,933 | 2,163 | 2,149 | 1,902 | 2,076 | 2,136 | 2,320 |
| 2020 | 2,298 | 1,957 | 2,083 | 1,729 | 1,844 | 1,959 | 2,057 | 1,901 | 1,696 | 1,834 | 1,923 | 1,832 |
| 2021 | 1,911 | 1,769 | 1,976 | 1,796 | 1,993 | 2,026 | 2,039 | 1,973 | 1,553 | 1,937 | 2,039 | 2,359 |
| 2022 | 2,041 | 1,815 | 2,167 | 2,350 | 2,085 | 2,149 | 2,250 | 2,138 | 2,110 | 2,125 | 2,069 | 2,175 |
| 2023 | 2,073 | 1,781 | 2,035 | 2,051 | 2,167 | 2,021 | 2,100 | 1,998 | 2,021 | 2,104 | 2,063 | 2,242 |
| 2024 | 1,976 | |||||||||||
| - = No Data Reported; -- = Not Applicable; NA = Not Available; W = Withheld to avoid disclosure of individual company data. |
| Release Date: 3/29/2024 |
| Next Release Date: 4/30/2024 |