|
Download Data (XLS File) |
|
||||||||
|
||||||||
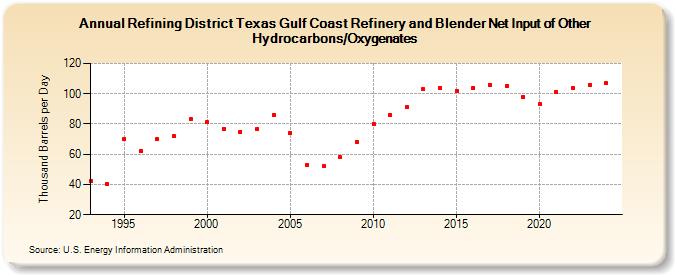
| Refining District Texas Gulf Coast Refinery and Blender Net Input of Other Hydrocarbons/Oxygenates (Thousand Barrels per Day) | ||||||||
| Decade | Year-0 | Year-1 | Year-2 | Year-3 | Year-4 | Year-5 | Year-6 | Year-7 | Year-8 | Year-9 |
|---|---|---|---|---|---|---|---|---|---|---|
| 1990's | 42 | 40 | 70 | 62 | 70 | 72 | 83 | |||
| 2000's | 81 | 77 | 75 | 77 | 86 | 74 | 53 | 52 | 58 | 68 |
| 2010's | 80 | 86 | 91 | 103 | 104 | 102 | 104 | 106 | 105 | 98 |
| 2020's | 93 | 101 | 104 | 106 |
| - = No Data Reported; -- = Not Applicable; NA = Not Available; W = Withheld to avoid disclosure of individual company data. |
| Release Date: 3/29/2024 |
| Next Release Date: 8/30/2024 |