|
Download Data (XLS File) |
|
||||||||
|
||||||||
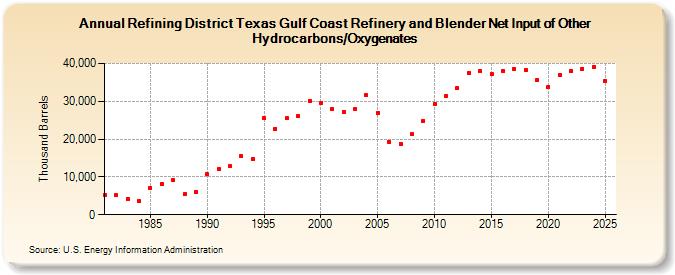
| Refining District Texas Gulf Coast Refinery and Blender Net Input of Other Hydrocarbons/Oxygenates (Thousand Barrels) | ||||||||
| Decade | Year-0 | Year-1 | Year-2 | Year-3 | Year-4 | Year-5 | Year-6 | Year-7 | Year-8 | Year-9 |
|---|---|---|---|---|---|---|---|---|---|---|
| 1980's | 5,150 | 5,145 | 4,178 | 3,652 | 7,106 | 8,186 | 9,157 | 5,450 | 6,092 | |
| 1990's | 10,675 | 12,021 | 12,809 | 15,421 | 14,685 | 25,623 | 22,790 | 25,489 | 26,146 | 30,113 |
| 2000's | 29,662 | 27,979 | 27,289 | 27,979 | 31,549 | 26,979 | 19,340 | 18,814 | 21,237 | 24,908 |
| 2010's | 29,336 | 31,409 | 33,474 | 37,610 | 37,954 | 37,270 | 38,039 | 38,540 | 38,294 | 35,653 |
| 2020's | 33,865 | 36,915 | 37,985 | 38,554 |
| - = No Data Reported; -- = Not Applicable; NA = Not Available; W = Withheld to avoid disclosure of individual company data. |
| Release Date: 3/29/2024 |
| Next Release Date: 8/30/2024 |