|
Download Data (XLS File) |
|
||||||||
|
||||||||
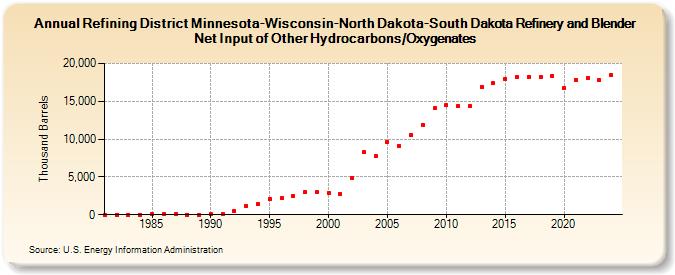
| Refining District Minnesota-Wisconsin-North Dakota-South Dakota Refinery and Blender Net Input of Other Hydrocarbons/Oxygenates (Thousand Barrels) | ||||||||
| Decade | Year-0 | Year-1 | Year-2 | Year-3 | Year-4 | Year-5 | Year-6 | Year-7 | Year-8 | Year-9 |
|---|---|---|---|---|---|---|---|---|---|---|
| 1980's | 0 | 0 | 0 | 0 | 120 | 114 | 34 | 18 | 24 | |
| 1990's | 50 | 154 | 501 | 1,186 | 1,410 | 2,027 | 2,198 | 2,477 | 2,985 | 2,949 |
| 2000's | 2,881 | 2,761 | 4,916 | 8,241 | 7,738 | 9,648 | 9,089 | 10,537 | 11,883 | 14,067 |
| 2010's | 14,507 | 14,377 | 14,400 | 16,931 | 17,410 | 18,010 | 18,204 | 18,225 | 18,231 | 18,383 |
| 2020's | 16,693 | 17,880 | 18,115 | 17,839 |
| - = No Data Reported; -- = Not Applicable; NA = Not Available; W = Withheld to avoid disclosure of individual company data. |
| Release Date: 3/29/2024 |
| Next Release Date: 8/30/2024 |