|
Download Data (XLS File) |
|
||||||||
|
||||||||
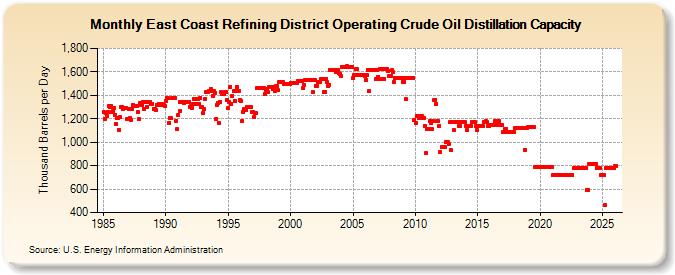
| East Coast Refining District Operating Crude Oil Distillation Capacity (Thousand Barrels per Day) | ||||||||
| Year | Jan | Feb | Mar | Apr | May | Jun | Jul | Aug | Sep | Oct | Nov | Dec |
|---|---|---|---|---|---|---|---|---|---|---|---|---|
| 1985 | 1,257 | 1,200 | 1,252 | 1,221 | 1,257 | 1,305 | 1,300 | 1,308 | 1,258 | 1,270 | 1,289 | 1,232 |
| 1986 | 1,155 | 1,209 | 1,209 | 1,105 | 1,212 | 1,298 | 1,298 | 1,287 | 1,290 | 1,293 | 1,293 | 1,199 |
| 1987 | 1,285 | 1,208 | 1,192 | 1,282 | 1,321 | 1,311 | 1,311 | 1,311 | 1,310 | 1,259 | 1,196 | 1,333 |
| 1988 | 1,314 | 1,314 | 1,342 | 1,284 | 1,339 | 1,342 | 1,298 | 1,339 | 1,339 | 1,341 | 1,330 | 1,330 |
| 1989 | 1,287 | 1,287 | 1,278 | 1,320 | 1,320 | 1,329 | 1,317 | 1,320 | 1,326 | 1,315 | 1,315 | 1,312 |
| 1990 | 1,353 | 1,381 | 1,378 | 1,168 | 1,204 | 1,204 | 1,381 | 1,378 | 1,381 | 1,378 | 1,184 | 1,109 |
| 1991 | 1,234 | 1,262 | 1,342 | 1,339 | 1,339 | 1,338 | 1,340 | 1,340 | 1,340 | 1,339 | 1,344 | 1,302 |
| 1992 | 1,307 | 1,294 | 1,329 | 1,371 | 1,371 | 1,329 | 1,329 | 1,371 | 1,329 | 1,380 | 1,300 | 1,300 |
| 1993 | 1,252 | 1,283 | 1,372 | 1,424 | 1,424 | 1,438 | 1,438 | 1,452 | 1,438 | 1,396 | 1,433 | 1,419 |
| 1994 | 1,198 | 1,318 | 1,332 | 1,160 | 1,346 | 1,426 | 1,412 | 1,412 | 1,412 | 1,425 | 1,425 | 1,359 |
| 1995 | 1,290 | 1,344 | 1,475 | 1,327 | 1,395 | 1,435 | 1,355 | 1,435 | 1,475 | 1,435 | 1,435 | 1,362 |
| 1996 | 1,350 | 1,178 | 1,258 | 1,286 | 1,286 | 1,272 | 1,301 | 1,301 | 1,297 | 1,297 | 1,297 | 1,257 |
| 1997 | 1,257 | 1,217 | 1,245 | 1,245 | 1,465 | 1,465 | 1,465 | 1,465 | 1,465 | 1,465 | 1,465 | 1,411 |
| 1998 | 1,439 | 1,453 | 1,427 | 1,467 | 1,467 | 1,467 | 1,467 | 1,453 | 1,467 | 1,440 | 1,477 | 1,477 |
| 1999 | 1,443 | 1,511 | 1,511 | 1,511 | 1,511 | 1,511 | 1,497 | 1,497 | 1,497 | 1,497 | 1,497 | 1,497 |
| 2000 | 1,509 | 1,509 | 1,509 | 1,509 | 1,509 | 1,509 | 1,509 | 1,523 | 1,523 | 1,523 | 1,523 | 1,523 |
| 2001 | 1,459 | 1,487 | 1,527 | 1,527 | 1,527 | 1,527 | 1,527 | 1,527 | 1,527 | 1,428 | 1,527 | 1,527 |
| 2002 | 1,483 | 1,483 | 1,511 | 1,511 | 1,511 | 1,541 | 1,541 | 1,541 | 1,426 | 1,426 | 1,541 | 1,511 |
| 2003 | 1,476 | 1,490 | 1,614 | 1,614 | 1,614 | 1,614 | 1,614 | 1,614 | 1,600 | 1,614 | 1,586 | 1,584 |
| 2004 | 1,564 | 1,642 | 1,642 | 1,642 | 1,642 | 1,642 | 1,647 | 1,641 | 1,641 | 1,641 | 1,641 | 1,641 |
| 2005 | 1,544 | 1,572 | 1,572 | 1,623 | 1,623 | 1,572 | 1,572 | 1,572 | 1,572 | 1,572 | 1,572 | 1,564 |
| 2006 | 1,532 | 1,572 | 1,618 | 1,433 | 1,618 | 1,618 | 1,618 | 1,618 | 1,618 | 1,618 | 1,538 | 1,618 |
| 2007 | 1,560 | 1,543 | 1,623 | 1,623 | 1,623 | 1,543 | 1,543 | 1,623 | 1,623 | 1,623 | 1,609 | 1,563 |
| 2008 | 1,567 | 1,613 | 1,595 | 1,515 | 1,547 | 1,547 | 1,547 | 1,547 | 1,547 | 1,547 | 1,547 | 1,547 |
| 2009 | 1,516 | 1,516 | 1,548 | 1,366 | 1,548 | 1,548 | 1,548 | 1,548 | 1,548 | 1,548 | 1,548 | 1,193 |
| 2010 | 1,162 | 1,222 | 1,222 | 1,208 | 1,222 | 1,222 | 1,222 | 1,208 | 1,208 | 1,142 | 904 | 1,110 |
| 2011 | 1,110 | 1,110 | 1,180 | 1,166 | 1,110 | 1,180 | 1,362 | 1,362 | 1,324 | 1,177 | 1,177 | 1,139 |
| 2012 | 915 | 959 | 959 | 959 | 959 | 999 | 999 | 999 | 985 | 1,170 | 932 | 1,170 |
| 2013 | 1,170 | 1,100 | 1,170 | 1,170 | 1,170 | 1,170 | 1,138 | 1,138 | 1,170 | 1,170 | 1,170 | 1,170 |
| 2014 | 1,170 | 1,138 | 1,100 | 1,138 | 1,138 | 1,138 | 1,170 | 1,170 | 1,170 | 1,170 | 1,138 | 1,100 |
| 2015 | 1,138 | 1,138 | 1,138 | 1,138 | 1,138 | 1,138 | 1,174 | 1,174 | 1,179 | 1,174 | 1,142 | 1,142 |
| 2016 | 1,147 | 1,147 | 1,147 | 1,147 | 1,179 | 1,147 | 1,147 | 1,179 | 1,179 | 1,147 | 1,147 | 1,147 |
| 2017 | 1,083 | 1,083 | 1,115 | 1,115 | 1,083 | 1,083 | 1,083 | 1,083 | 1,083 | 1,083 | 1,083 | 1,083 |
| 2018 | 1,125 | 1,125 | 1,125 | 1,125 | 1,125 | 1,125 | 1,125 | 1,125 | 1,125 | 935 | 1,125 | 1,125 |
| 2019 | 1,126 | 1,126 | 1,126 | 1,126 | 1,126 | 1,126 | 1,126 | 791 | 791 | 791 | 791 | 791 |
| 2020 | 791 | 791 | 791 | 791 | 791 | 791 | 791 | 791 | 791 | 791 | 791 | 791 |
| 2021 | 720 | 720 | 720 | 720 | 720 | 720 | 720 | 720 | 720 | 720 | 720 | 720 |
| 2022 | 720 | 720 | 720 | 720 | 720 | 720 | 720 | 720 | 780 | 780 | 780 | 780 |
| 2023 | 780 | 780 | 780 | 780 | 780 | 780 | 780 | 780 | 780 | 590 | 590 | 812 |
| 2024 | 812 | |||||||||||
| - = No Data Reported; -- = Not Applicable; NA = Not Available; W = Withheld to avoid disclosure of individual company data. |
| Release Date: 3/29/2024 |
| Next Release Date: 4/30/2024 |
Referring Pages: