|
Download Data (XLS File) |
|
||||||||
|
||||||||
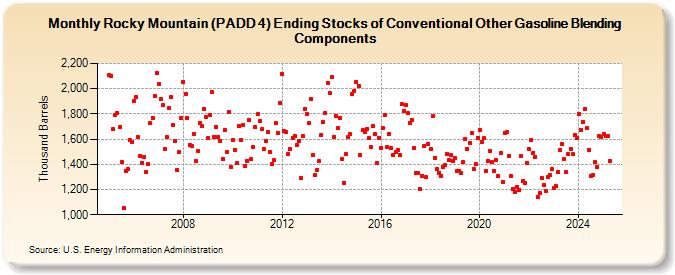
| Rocky Mountain (PADD 4) Ending Stocks of Conventional Other Gasoline Blending Components (Thousand Barrels) | ||||||||
| Year | Jan | Feb | Mar | Apr | May | Jun | Jul | Aug | Sep | Oct | Nov | Dec |
|---|---|---|---|---|---|---|---|---|---|---|---|---|
| 2005 | 2,107 | 2,103 | 1,678 | 1,794 | 1,810 | 1,694 | 1,417 | 1,053 | 1,349 | 1,359 | 1,593 | 1,580 |
| 2006 | 1,903 | 1,937 | 1,618 | 1,468 | 1,413 | 1,461 | 1,342 | 1,399 | 1,724 | 1,771 | 1,940 | 2,127 |
| 2007 | 2,034 | 1,917 | 1,872 | 1,523 | 1,617 | 1,846 | 1,933 | 1,710 | 1,585 | 1,355 | 1,497 | 1,771 |
| 2008 | 2,055 | 1,958 | 1,770 | 1,556 | 1,548 | 1,644 | 1,430 | 1,502 | 1,727 | 1,700 | 1,842 | 1,777 |
| 2009 | 1,605 | 1,794 | 1,970 | 1,620 | 1,695 | 1,618 | 1,583 | 1,443 | 1,672 | 1,495 | 1,818 | 1,376 |
| 2010 | 1,589 | 1,515 | 1,408 | 1,705 | 1,591 | 1,711 | 1,387 | 1,430 | 1,749 | 1,440 | 1,537 | 1,693 |
| 2011 | 1,798 | 1,744 | 1,678 | 1,521 | 1,584 | 1,656 | 1,501 | 1,401 | 1,438 | 1,724 | 1,648 | 1,888 |
| 2012 | 2,117 | 1,665 | 1,657 | 1,481 | 1,522 | 1,612 | 1,624 | 1,555 | 1,588 | 1,289 | 1,628 | 1,839 |
| 2013 | 1,799 | 1,726 | 1,917 | 1,474 | 1,317 | 1,357 | 1,423 | 1,633 | 1,732 | 1,809 | 2,046 | 1,969 |
| 2014 | 2,089 | 1,620 | 1,783 | 1,691 | 1,771 | 1,439 | 1,255 | 1,478 | 1,613 | 1,639 | 1,960 | 1,985 |
| 2015 | 2,052 | 2,024 | 1,470 | 1,670 | 1,660 | 1,681 | 1,612 | 1,541 | 1,705 | 1,639 | 1,413 | 1,611 |
| 2016 | 1,530 | 1,687 | 1,789 | 1,537 | 1,641 | 1,526 | 1,474 | 1,494 | 1,514 | 1,473 | 1,875 | 1,825 |
| 2017 | 1,867 | 1,806 | 1,729 | 1,752 | 1,531 | 1,332 | 1,333 | 1,201 | 1,310 | 1,546 | 1,297 | 1,558 |
| 2018 | 1,523 | 1,781 | 1,453 | 1,361 | 1,333 | 1,307 | 1,382 | 1,392 | 1,482 | 1,432 | 1,470 | 1,427 |
| 2019 | 1,450 | 1,345 | 1,348 | 1,331 | 1,417 | 1,602 | 1,525 | 1,570 | 1,646 | 1,361 | 1,400 | 1,611 |
| 2020 | 1,674 | 1,578 | 1,605 | 1,348 | 1,426 | 1,508 | 1,418 | 1,347 | 1,431 | 1,310 | 1,487 | 1,262 |
| 2021 | 1,649 | 1,653 | 1,467 | 1,311 | 1,205 | 1,182 | 1,220 | 1,198 | 1,462 | 1,271 | 1,248 | 1,408 |
| 2022 | 1,519 | 1,593 | 1,493 | 1,460 | 1,140 | 1,169 | 1,295 | 1,235 | 1,185 | 1,300 | 1,315 | 1,359 |
| 2023 | 1,209 | 1,224 | 1,338 | 1,510 | 1,560 | 1,446 | 1,340 | 1,482 | 1,522 | 1,478 | 1,636 | 1,609 |
| 2024 | 1,796 | 1,672 | 1,739 | 1,840 | 1,685 | 1,511 | 1,306 | 1,314 | 1,417 | 1,379 | 1,627 | 1,620 |
| 2025 | 1,641 | 1,622 | 1,626 | 1,429 | ||||||||
| - = No Data Reported; -- = Not Applicable; NA = Not Available; W = Withheld to avoid disclosure of individual company data. |
| Release Date: 6/30/2025 |
| Next Release Date: 7/31/2025 |