|
Download Data (XLS File) |
|
||||||||
|
||||||||
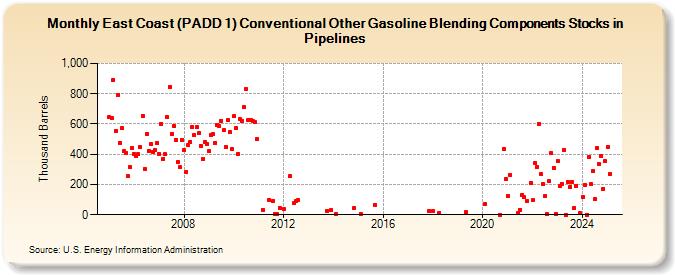
| East Coast (PADD 1) Conventional Other Gasoline Blending Components Stocks in Pipelines (Thousand Barrels) | ||||||||
| Year | Jan | Feb | Mar | Apr | May | Jun | Jul | Aug | Sep | Oct | Nov | Dec |
|---|---|---|---|---|---|---|---|---|---|---|---|---|
| 2005 | 643 | 637 | 894 | 556 | 791 | 477 | 573 | 419 | 409 | 253 | 315 | 438 |
| 2006 | 401 | 387 | 399 | 449 | 656 | 303 | 535 | 423 | 465 | 415 | 428 | 473 |
| 2007 | 404 | 602 | 371 | 399 | 644 | 845 | 534 | 587 | 496 | 349 | 313 | 495 |
| 2008 | 425 | 280 | 459 | 484 | 583 | 524 | 578 | 538 | 456 | 368 | 480 | 468 |
| 2009 | 418 | 528 | 531 | 477 | 594 | 588 | 622 | 559 | 449 | 626 | 544 | 436 |
| 2010 | 650 | 575 | 402 | 631 | 621 | 711 | 831 | 628 | 627 | 621 | 616 | 500 |
| 2011 | 33 | 99 | 93 | 5 | 5 | 47 | ||||||
| 2012 | 38 | 253 | 75 | 93 | 97 | |||||||
| 2013 | 24 | 30 | ||||||||||
| 2014 | 6 | 46 | ||||||||||
| 2015 | 6 | 65 | ||||||||||
| 2017 | 25 | |||||||||||
| 2018 | 24 | 12 | ||||||||||
| 2019 | 15 | |||||||||||
| 2020 | 73 | 1 | 436 | 237 | ||||||||
| 2021 | 124 | 265 | 11 | 33 | 133 | 115 | 92 | 213 | ||||
| 2022 | 97 | 339 | 318 | 602 | 272 | 205 | 122 | 3 | 222 | 408 | 312 | 2 |
| 2023 | 355 | 189 | 205 | 428 | 1 | 219 | 186 | 216 | 45 | 191 | 9 | |
| 2024 | 114 | |||||||||||
| - = No Data Reported; -- = Not Applicable; NA = Not Available; W = Withheld to avoid disclosure of individual company data. |
| Release Date: 3/29/2024 |
| Next Release Date: 4/30/2024 |