|
Download Data (XLS File) |
|
||||||||
|
||||||||
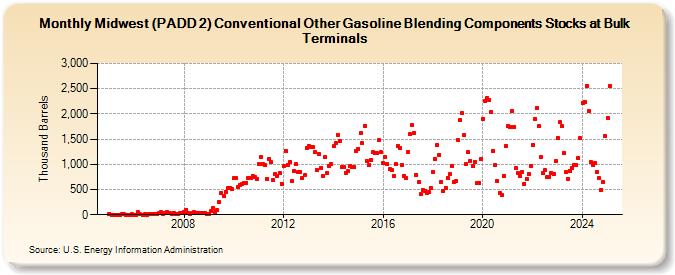
| Midwest (PADD 2) Conventional Other Gasoline Blending Components Stocks at Bulk Terminals (Thousand Barrels) | ||||||||
| Year | Jan | Feb | Mar | Apr | May | Jun | Jul | Aug | Sep | Oct | Nov | Dec |
|---|---|---|---|---|---|---|---|---|---|---|---|---|
| 2005 | 24 | 2 | 4 | 3 | 3 | 3 | 6 | 7 | 4 | 4 | 4 | 5 |
| 2006 | 4 | 4 | 50 | 7 | 4 | 5 | 4 | 5 | 10 | 10 | 20 | 23 |
| 2007 | 34 | 46 | 15 | 26 | 48 | 38 | 20 | 30 | 19 | 8 | 32 | 27 |
| 2008 | 53 | 101 | 35 | 18 | 37 | 49 | 40 | 40 | 30 | 38 | 28 | 23 |
| 2009 | 23 | 67 | 139 | 45 | 84 | 261 | 431 | 365 | 457 | 531 | 538 | 503 |
| 2010 | 722 | 722 | 554 | 590 | 612 | 637 | 637 | 728 | 734 | 773 | 745 | 716 |
| 2011 | 1,008 | 1,148 | 1,008 | 982 | 718 | 1,110 | 1,039 | 690 | 811 | 767 | 828 | 611 |
| 2012 | 971 | 1,268 | 987 | 1,049 | 665 | 871 | 998 | 844 | 850 | 731 | 782 | 1,322 |
| 2013 | 1,372 | 1,346 | 1,341 | 1,241 | 893 | 1,202 | 934 | 765 | 1,135 | 831 | 976 | 999 |
| 2014 | 1,356 | 1,426 | 1,587 | 1,472 | 946 | 938 | 829 | 858 | 972 | 953 | 938 | 1,262 |
| 2015 | 1,306 | 1,613 | 1,414 | 1,757 | 1,072 | 979 | 1,080 | 1,241 | 1,218 | 1,219 | 1,475 | 1,237 |
| 2016 | 1,016 | 1,135 | 1,006 | 897 | 878 | 764 | 1,002 | 1,366 | 1,327 | 996 | 772 | 731 |
| 2017 | 1,249 | 1,593 | 1,773 | 1,621 | 795 | 643 | 407 | 497 | 473 | 432 | 445 | 532 |
| 2018 | 843 | 1,110 | 1,380 | 1,185 | 652 | 475 | 538 | 735 | 802 | 957 | 649 | 659 |
| 2019 | 1,484 | 1,871 | 2,010 | 1,574 | 1,000 | 1,238 | 1,067 | 963 | 1,052 | 622 | 634 | 1,108 |
| 2020 | 1,897 | 2,252 | 2,312 | 2,274 | 2,034 | 1,269 | 984 | 665 | 436 | 385 | 775 | 1,371 |
| 2021 | 1,760 | 1,741 | 2,051 | 1,741 | 918 | 827 | 768 | 851 | 617 | 706 | 809 | 972 |
| 2022 | 1,389 | 1,901 | 2,116 | 1,755 | 1,137 | 830 | 880 | 746 | 753 | 835 | 800 | 1,057 |
| 2023 | 1,521 | 1,833 | 1,752 | 1,225 | 841 | 686 | 820 | 927 | 986 | 988 | 1,124 | 1,513 |
| 2024 | 2,214 | |||||||||||
| - = No Data Reported; -- = Not Applicable; NA = Not Available; W = Withheld to avoid disclosure of individual company data. |
| Release Date: 3/29/2024 |
| Next Release Date: 4/30/2024 |