|
Download Data (XLS File) |
|
||||||||
|
||||||||
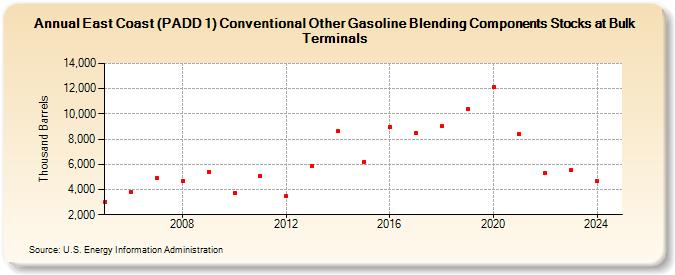
| East Coast (PADD 1) Conventional Other Gasoline Blending Components Stocks at Bulk Terminals (Thousand Barrels) | ||||||||
| Decade | Year-0 | Year-1 | Year-2 | Year-3 | Year-4 | Year-5 | Year-6 | Year-7 | Year-8 | Year-9 |
|---|---|---|---|---|---|---|---|---|---|---|
| 2000's | 3,021 | 3,824 | 4,904 | 4,643 | 5,427 | |||||
| 2010's | 3,707 | 5,061 | 3,457 | 5,890 | 8,627 | 6,213 | 8,987 | 8,498 | 9,043 | 10,352 |
| 2020's | 12,105 | 8,413 | 5,288 | 5,595 |
| - = No Data Reported; -- = Not Applicable; NA = Not Available; W = Withheld to avoid disclosure of individual company data. |
| Release Date: 6/28/2024 |
| Next Release Date: 8/30/2024 |