|
Download Data (XLS File) |
|
||||||||
|
||||||||
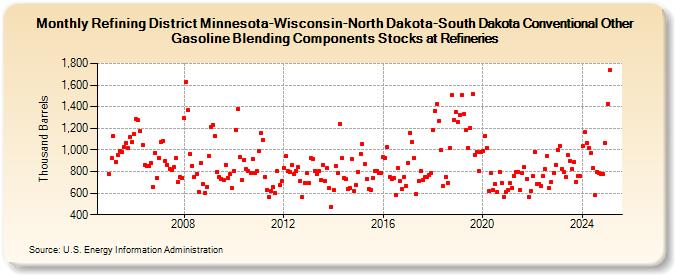
| Refining District Minnesota-Wisconsin-North Dakota-South Dakota Conventional Other Gasoline Blending Components Stocks at Refineries (Thousand Barrels) | ||||||||
| Year | Jan | Feb | Mar | Apr | May | Jun | Jul | Aug | Sep | Oct | Nov | Dec |
|---|---|---|---|---|---|---|---|---|---|---|---|---|
| 2005 | 774 | 923 | 1,128 | 890 | 955 | 989 | 976 | 1,027 | 1,064 | 1,014 | 1,119 | 1,070 |
| 2006 | 1,147 | 1,282 | 1,273 | 1,171 | 1,045 | 860 | 854 | 850 | 876 | 661 | 975 | 743 |
| 2007 | 929 | 1,074 | 1,081 | 898 | 862 | 826 | 818 | 839 | 923 | 699 | 750 | 744 |
| 2008 | 1,292 | 1,627 | 1,366 | 960 | 855 | 750 | 780 | 611 | 877 | 686 | 599 | 660 |
| 2009 | 946 | 1,215 | 1,234 | 1,125 | 799 | 749 | 735 | 723 | 859 | 744 | 774 | 645 |
| 2010 | 808 | 1,184 | 1,379 | 936 | 718 | 909 | 820 | 802 | 790 | 917 | 784 | 801 |
| 2011 | 991 | 1,153 | 1,094 | 752 | 632 | 561 | 621 | 654 | 600 | 805 | 673 | 708 |
| 2012 | 833 | 940 | 802 | 791 | 860 | 773 | 809 | 838 | 715 | 563 | 697 | 783 |
| 2013 | 695 | 924 | 914 | 807 | 778 | 804 | 719 | 861 | 709 | 829 | 647 | 474 |
| 2014 | 626 | 854 | 786 | 1,236 | 929 | 743 | 728 | 640 | 648 | 912 | 618 | 673 |
| 2015 | 799 | 966 | 1,055 | 865 | 732 | 635 | 632 | 744 | 807 | 802 | 790 | 787 |
| 2016 | 938 | 928 | 1,023 | 748 | 727 | 739 | 578 | 834 | 709 | 640 | 753 | 670 |
| 2017 | 881 | 1,161 | 1,074 | 927 | 591 | 708 | 804 | 720 | 746 | 748 | 765 | 789 |
| 2018 | 1,182 | 1,359 | 1,429 | 1,269 | 997 | 665 | 752 | 693 | 1,014 | 1,504 | 1,281 | 1,355 |
| 2019 | 1,262 | 1,325 | 1,508 | 1,336 | 1,181 | 1,019 | 1,205 | 1,520 | 957 | 981 | 808 | 976 |
| 2020 | 991 | 1,130 | 1,022 | 617 | 785 | 633 | 682 | 611 | 794 | 696 | 564 | 611 |
| 2021 | 633 | 690 | 651 | 761 | 797 | 798 | 627 | 785 | 838 | 731 | 564 | 621 |
| 2022 | 755 | 983 | 684 | 685 | 668 | 754 | 822 | 941 | 644 | 705 | 789 | 863 |
| 2023 | 1,003 | 1,037 | 827 | 799 | 747 | 950 | 900 | 819 | 892 | 707 | 758 | 763 |
| 2024 | 1,032 | |||||||||||
| - = No Data Reported; -- = Not Applicable; NA = Not Available; W = Withheld to avoid disclosure of individual company data. |
| Release Date: 3/29/2024 |
| Next Release Date: 4/30/2024 |