|
Download Data (XLS File) |
|
||||||||
|
||||||||
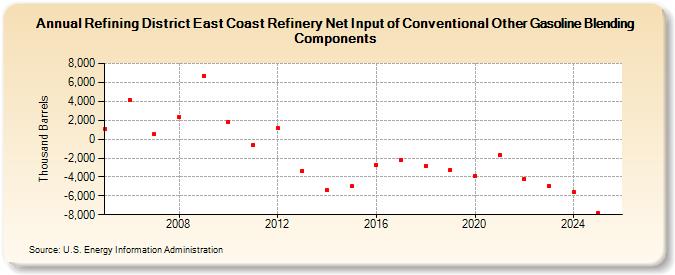
| Refining District East Coast Refinery Net Input of Conventional Other Gasoline Blending Components (Thousand Barrels) | ||||||||
| Decade | Year-0 | Year-1 | Year-2 | Year-3 | Year-4 | Year-5 | Year-6 | Year-7 | Year-8 | Year-9 |
|---|---|---|---|---|---|---|---|---|---|---|
| 2000's | 1,118 | 4,169 | 496 | 2,305 | 6,696 | |||||
| 2010's | 1,807 | -616 | 1,173 | -3,332 | -5,411 | -4,999 | -2,744 | -2,167 | -2,817 | -3,229 |
| 2020's | -3,853 | -1,704 | -4,197 | -4,981 |
| - = No Data Reported; -- = Not Applicable; NA = Not Available; W = Withheld to avoid disclosure of individual company data. |
| Release Date: 3/29/2024 |
| Next Release Date: 8/30/2024 |