|
Download Data (XLS File) |
|
||||||||
|
||||||||
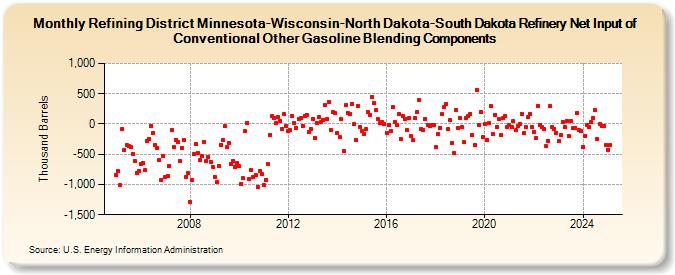
| Refining District Minnesota-Wisconsin-North Dakota-South Dakota Refinery Net Input of Conventional Other Gasoline Blending Components (Thousand Barrels) | ||||||||
| Year | Jan | Feb | Mar | Apr | May | Jun | Jul | Aug | Sep | Oct | Nov | Dec |
|---|---|---|---|---|---|---|---|---|---|---|---|---|
| 2005 | -842 | -783 | -1,005 | -77 | -438 | -351 | -365 | -387 | -495 | -605 | -808 | -771 |
| 2006 | -658 | -647 | -767 | -278 | -247 | -28 | -152 | -347 | -402 | -592 | -918 | -531 |
| 2007 | -874 | -854 | -693 | -102 | -385 | -260 | -296 | -608 | -396 | -257 | -872 | -816 |
| 2008 | -1,284 | -922 | -494 | -327 | -482 | -596 | -536 | -293 | -606 | -538 | -625 | -706 |
| 2009 | -869 | -967 | -690 | -341 | -268 | -40 | -385 | -309 | -663 | -607 | -719 | -646 |
| 2010 | -701 | -995 | -901 | -124 | 23 | -917 | -764 | -871 | -843 | -1,041 | -783 | -834 |
| 2011 | -1,015 | -919 | -667 | -175 | 126 | 95 | 16 | 112 | 57 | -84 | 157 | -32 |
| 2012 | -123 | -105 | 140 | 12 | -68 | 88 | 91 | -29 | 136 | 155 | -129 | -82 |
| 2013 | 90 | -228 | 12 | 108 | 30 | 71 | 309 | 86 | 369 | -106 | 190 | 179 |
| 2014 | -148 | -222 | 74 | -448 | 309 | 187 | 172 | 338 | -6 | -259 | 300 | -48 |
| 2015 | -120 | -163 | -87 | 192 | 151 | 448 | 354 | 229 | 78 | 10 | 28 | 3 |
| 2016 | -144 | -9 | -116 | 276 | 26 | -12 | 162 | -246 | 130 | 74 | -107 | 91 |
| 2017 | -203 | -272 | 91 | 195 | 396 | -87 | -93 | 87 | -16 | -39 | -10 | -18 |
| 2018 | -385 | -172 | -64 | 167 | 274 | 335 | -86 | 64 | -314 | -484 | 227 | -69 |
| 2019 | 101 | -58 | -303 | 96 | 128 | 166 | -183 | -346 | 564 | -17 | 202 | -221 |
| 2020 | 0 | -259 | 9 | 303 | -164 | 154 | -44 | 77 | -177 | 102 | 140 | -43 |
| 2021 | -19 | -55 | 45 | -107 | -34 | 4 | 172 | -150 | -51 | 115 | 169 | -51 |
| 2022 | -131 | -225 | 303 | -11 | -55 | -85 | -371 | -277 | 299 | -54 | -79 | -144 |
| 2023 | -285 | -181 | 37 | -42 | 56 | -199 | 46 | -67 | -73 | 187 | -106 | -122 |
| 2024 | -381 | |||||||||||
| - = No Data Reported; -- = Not Applicable; NA = Not Available; W = Withheld to avoid disclosure of individual company data. |
| Release Date: 3/29/2024 |
| Next Release Date: 4/30/2024 |