|
Download Data (XLS File) |
|
||||||||
|
||||||||
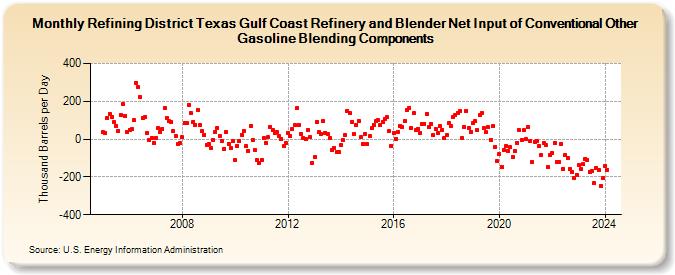
| Refining District Texas Gulf Coast Refinery and Blender Net Input of Conventional Other Gasoline Blending Components (Thousand Barrels per Day) | ||||||||
| Year | Jan | Feb | Mar | Apr | May | Jun | Jul | Aug | Sep | Oct | Nov | Dec |
|---|---|---|---|---|---|---|---|---|---|---|---|---|
| 2005 | 36 | 32 | 112 | 134 | 117 | 89 | 71 | 45 | 130 | 185 | 124 | 36 |
| 2006 | 49 | 52 | 99 | 299 | 273 | 222 | 113 | 118 | 32 | -5 | 7 | -19 |
| 2007 | 7 | 58 | 36 | 56 | 164 | 113 | 94 | 91 | 42 | 16 | -24 | -20 |
| 2008 | 9 | 85 | 85 | 183 | 136 | 93 | 76 | 156 | 73 | 41 | 23 | -29 |
| 2009 | -26 | -49 | -4 | 40 | 59 | 17 | -9 | -50 | 35 | -24 | -47 | -9 |
| 2010 | -112 | -34 | -11 | 23 | 41 | -39 | -63 | 69 | -6 | -57 | -112 | -125 |
| 2011 | -109 | 5 | -18 | 9 | 65 | 46 | 33 | 40 | 14 | 1 | -39 | -21 |
| 2012 | 33 | 15 | 53 | 72 | 163 | 76 | 27 | 5 | -2 | 46 | 11 | -126 |
| 2013 | -97 | 93 | 35 | 28 | 94 | 34 | 28 | 5 | -59 | -45 | -68 | -70 |
| 2014 | -30 | -5 | 21 | 151 | 136 | 91 | 29 | 77 | 97 | 9 | -25 | 29 |
| 2015 | -27 | 15 | 58 | 75 | 94 | 99 | 75 | 91 | 108 | 115 | 42 | -34 |
| 2016 | 33 | 2 | 39 | 71 | 65 | 97 | 155 | 165 | 58 | 136 | 47 | 56 |
| 2017 | 32 | 79 | 82 | 135 | 62 | 82 | 22 | 54 | 33 | 69 | 50 | 7 |
| 2018 | 22 | 85 | 69 | 118 | 125 | 140 | 146 | 5 | 66 | 150 | 60 | 39 |
| 2019 | 87 | 94 | 47 | 127 | 139 | 58 | 36 | 62 | -3 | 69 | -41 | -118 |
| 2020 | -80 | -146 | -57 | -37 | -61 | -43 | -95 | -64 | -18 | 47 | -4 | 46 |
| 2021 | -2 | 63 | -10 | -120 | -14 | -8 | -39 | -84 | -20 | -31 | -147 | -84 |
| 2022 | -76 | -21 | -120 | -119 | -24 | -158 | -83 | -101 | -158 | -173 | -204 | -188 |
| 2023 | -138 | -160 | -133 | -103 | -111 | -172 | -167 | -234 | -152 | -161 | -246 | -204 |
| 2024 | -144 | -161 | -317 | -236 | -268 | -312 | ||||||
| - = No Data Reported; -- = Not Applicable; NA = Not Available; W = Withheld to avoid disclosure of individual company data. |
| Release Date: 8/30/2024 |
| Next Release Date: 9/30/2024 |