|
Download Data (XLS File) |
|
||||||||
|
||||||||
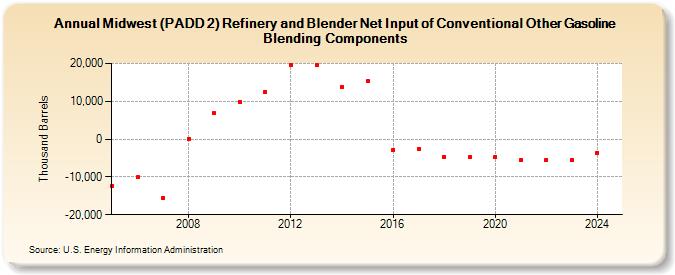
| Midwest (PADD 2) Refinery and Blender Net Input of Conventional Other Gasoline Blending Components (Thousand Barrels) | ||||||||
| Decade | Year-0 | Year-1 | Year-2 | Year-3 | Year-4 | Year-5 | Year-6 | Year-7 | Year-8 | Year-9 |
|---|---|---|---|---|---|---|---|---|---|---|
| 2000's | -12,370 | -10,096 | -15,478 | 105 | 6,846 | |||||
| 2010's | 9,887 | 12,561 | 19,528 | 19,501 | 13,898 | 15,305 | -2,846 | -2,497 | -4,644 | -4,801 |
| 2020's | -4,652 | -5,432 | -5,426 | -5,496 |
| - = No Data Reported; -- = Not Applicable; NA = Not Available; W = Withheld to avoid disclosure of individual company data. |
| Release Date: 3/29/2024 |
| Next Release Date: 8/30/2024 |