|
Download Data (XLS File) |
|
||||||||
|
||||||||
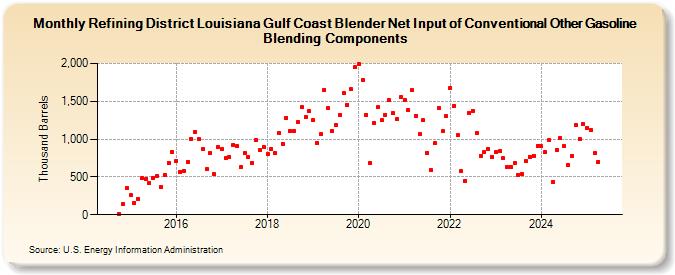
| Refining District Louisiana Gulf Coast Blender Net Input of Conventional Other Gasoline Blending Components (Thousand Barrels) | ||||||||
| Year | Jan | Feb | Mar | Apr | May | Jun | Jul | Aug | Sep | Oct | Nov | Dec |
|---|---|---|---|---|---|---|---|---|---|---|---|---|
| 2014 | 14 | 137 | 352 | |||||||||
| 2015 | 258 | 160 | 210 | 484 | 467 | 421 | 487 | 508 | 368 | 526 | 684 | 831 |
| 2016 | 714 | 571 | 583 | 701 | 1,005 | 1,098 | 996 | 866 | 603 | 816 | 535 | 897 |
| 2017 | 864 | 748 | 767 | 928 | 909 | 626 | 815 | 766 | 689 | 982 | 854 | 897 |
| 2018 | 805 | 867 | 816 | 1,075 | 941 | 1,285 | 1,110 | 1,102 | 1,224 | 1,419 | 1,294 | 1,367 |
| 2019 | 1,248 | 949 | 1,064 | 1,653 | 1,405 | 1,109 | 1,191 | 1,322 | 1,611 | 1,451 | 1,657 | 1,949 |
| 2020 | 1,987 | 1,788 | 1,325 | 686 | 1,216 | 1,421 | 1,254 | 1,324 | 1,513 | 1,341 | 1,269 | 1,555 |
| 2021 | 1,522 | 1,382 | 1,643 | 1,309 | 1,061 | 1,246 | 821 | 590 | 945 | 1,411 | 1,102 | 1,300 |
| 2022 | 1,680 | 1,441 | 1,049 | 572 | 448 | 1,349 | 1,378 | 1,080 | 782 | 827 | 872 | 767 |
| 2023 | 823 | 836 | 745 | 635 | 634 | 690 | 529 | 537 | 712 | 768 | 781 | 914 |
| 2024 | 903 | 826 | 988 | 436 | 860 | 1,014 | 904 | 654 | 771 | 1,188 | 1,003 | 1,202 |
| 2025 | 1,149 | 1,120 | 812 | 703 | ||||||||
| - = No Data Reported; -- = Not Applicable; NA = Not Available; W = Withheld to avoid disclosure of individual company data. |
| Release Date: 6/30/2025 |
| Next Release Date: 7/31/2025 |