|
Download Data (XLS File) |
|
||||||||
|
||||||||
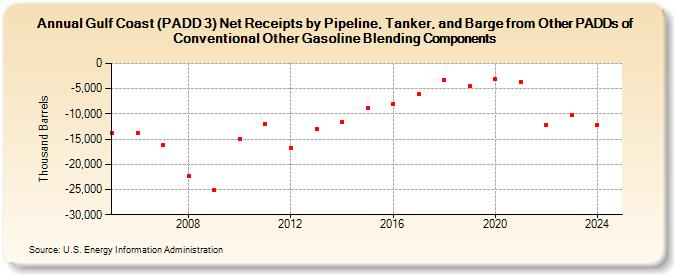
| Gulf Coast (PADD 3) Net Receipts by Pipeline, Tanker, and Barge from Other PADDs of Conventional Other Gasoline Blending Components (Thousand Barrels) | ||||||||
| Decade | Year-0 | Year-1 | Year-2 | Year-3 | Year-4 | Year-5 | Year-6 | Year-7 | Year-8 | Year-9 |
|---|---|---|---|---|---|---|---|---|---|---|
| 2000's | -13,778 | -13,824 | -16,258 | -22,314 | -25,088 | |||||
| 2010's | -14,903 | -12,077 | -16,691 | -12,929 | -11,527 | -8,839 | -8,026 | -6,119 | -3,277 | -4,537 |
| 2020's | -3,176 | -3,699 | -12,149 | -10,186 |
| - = No Data Reported; -- = Not Applicable; NA = Not Available; W = Withheld to avoid disclosure of individual company data. |
| Release Date: 4/30/2024 |
| Next Release Date: 8/30/2024 |
Referring Pages: