|
Download Data (XLS File) |
|
||||||||
|
||||||||
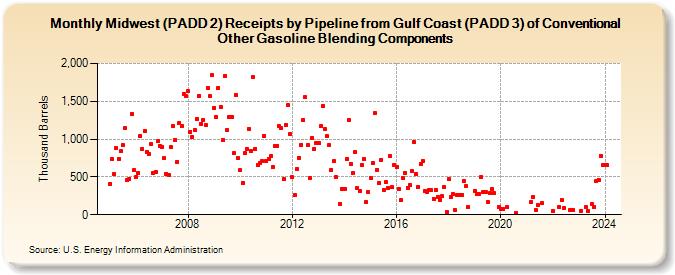
| Midwest (PADD 2) Receipts by Pipeline from Gulf Coast (PADD 3) of Conventional Other Gasoline Blending Components (Thousand Barrels) | ||||||||
| Year | Jan | Feb | Mar | Apr | May | Jun | Jul | Aug | Sep | Oct | Nov | Dec |
|---|---|---|---|---|---|---|---|---|---|---|---|---|
| 2005 | 411 | 735 | 538 | 882 | 741 | 836 | 921 | 1,141 | 455 | 478 | 1,337 | 585 |
| 2006 | 505 | 552 | 1,038 | 867 | 1,104 | 834 | 806 | 940 | 552 | 567 | 970 | 914 |
| 2007 | 900 | 745 | 544 | 526 | 894 | 1,167 | 992 | 703 | 1,218 | 1,178 | 1,600 | 1,566 |
| 2008 | 1,635 | 1,099 | 1,028 | 1,123 | 1,272 | 1,575 | 1,203 | 1,252 | 1,183 | 1,682 | 1,568 | 1,844 |
| 2009 | 1,414 | 1,291 | 1,681 | 1,426 | 990 | 1,832 | 1,115 | 1,295 | 1,298 | 810 | 1,582 | 745 |
| 2010 | 591 | 423 | 816 | 874 | 1,139 | 840 | 1,817 | 873 | 658 | 685 | 705 | 1,044 |
| 2011 | 706 | 741 | 775 | 630 | 904 | 914 | 1,171 | 1,143 | 472 | 1,187 | 1,445 | 1,063 |
| 2012 | 494 | 255 | 605 | 756 | 922 | 1,254 | 1,553 | 921 | 487 | 1,015 | 875 | 953 |
| 2013 | 948 | 1,170 | 1,437 | 1,129 | 1,035 | 922 | 596 | 704 | 498 | 140 | 342 | |
| 2014 | 345 | 735 | 1,256 | 670 | 549 | 828 | 349 | 317 | 660 | 735 | 167 | 296 |
| 2015 | 481 | 684 | 1,342 | 596 | 420 | 730 | 328 | 427 | 359 | 770 | 366 | 659 |
| 2016 | 633 | 345 | 192 | 482 | 557 | 358 | 395 | 581 | 960 | 537 | 364 | 672 |
| 2017 | 713 | 314 | 304 | 327 | 325 | 213 | 330 | 240 | 199 | 243 | 367 | 39 |
| 2018 | 466 | 234 | 276 | 60 | 267 | 262 | 266 | 450 | 375 | 101 | ||
| 2019 | 311 | 278 | 273 | 504 | 302 | 297 | 171 | 285 | 343 | 283 | 100 | |
| 2020 | 80 | 79 | 99 | 21 | ||||||||
| 2021 | 164 | 236 | 65 | 125 | 150 | |||||||
| 2022 | 50 | 100 | 200 | 91 | 58 | 58 | ||||||
| 2023 | 53 | 99 | 48 | 140 | 100 | 452 | 465 | 782 | 653 | |||
| 2024 | 653 | |||||||||||
| - = No Data Reported; -- = Not Applicable; NA = Not Available; W = Withheld to avoid disclosure of individual company data. |
| Release Date: 3/29/2024 |
| Next Release Date: 4/30/2024 |